假阳性/阴性层
目的:学习如何创建假阳性/阴性矢量数据集。
预计完成时间:40分钟
互联网接入:不需要
点击QGIS内的Trends.Earth工具条,并点击Trends.Earth图标。
将打开**趋势.地球**菜单。在**数据集**窗口中,如果在设置中勾选了**自动下载远程生成的数据集**,现有的任务就会列在菜单中。
备注
请参阅本手册的 ref:`tut_settings`部分,以了解更多关于**高级设置**的信息。
如果菜单中没有出现数据集,请选择 "刷新 "按钮。
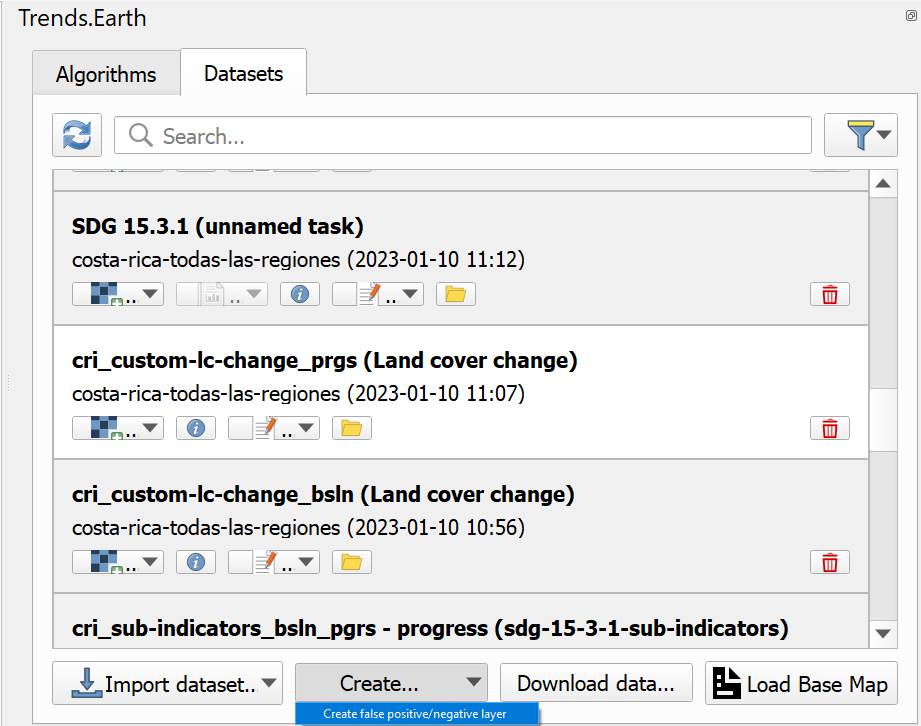
Press the Create button at the bottom of the Trends.Earth menu and then select False positive/negative layer
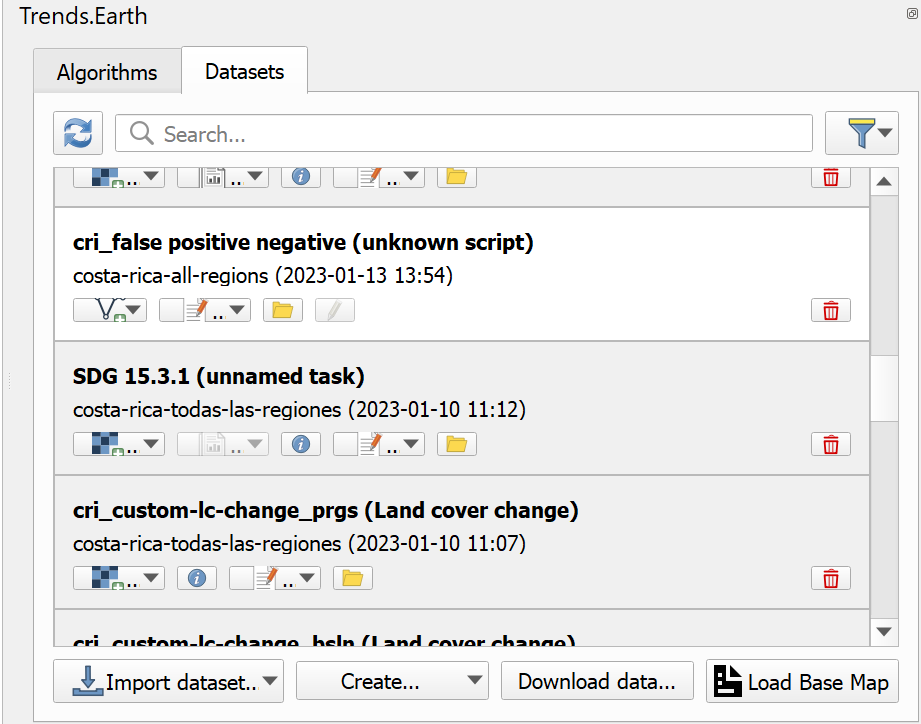
一个名为 "假阳性/阴性 "的新数据集将被添加到**数据集**窗口。
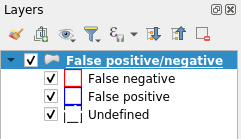
要将矢量数据集添加到QGIS地图画布上进行查看,请使用**添加到画布**按钮。

图层将被添加到预定义的样式中,如下文所示。
要在数据集中定义区域,必须使用**编辑图层**按钮将其添加到QGIS地图画布中。
If this is the first time a false positive/negative layer is added to QGIS canvas a dialog asking for indicator layers will be shown
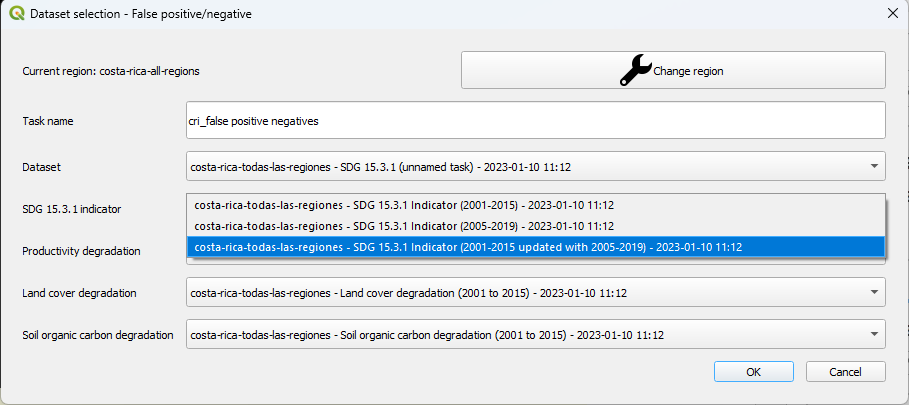
In this dialog it is necessary to correctly select corresponding indicator layers which will be used to calculate charts - special attention when selecting the layer for SDG 15.3.1 indicator, make sure to select the SDG 15.3.1 Indicator that has been updated with the respective progress period. This is a one-time action, choice made in this dialog will be preserved and used in all subsequent edits of this specific vector dataset.
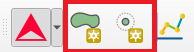
Once the dataset added to the canvas in editing mode, polygons can be created using either Polygon tool or Buffer tool which can be found on the Trends.Earth toolbar.
**Polygon**工具用于手动数字化多边形,使用与本地QGIS数字化工具相同的点选方法。当**多边形**工具被选中并在QGIS地图画布的右上角开始数字化时,将显示一个显示多边形区域的小部件。

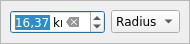
**缓冲区**工具用于通过选择中心点和定义半径或该中心点周围的圆的面积来实现多边形的数字化。一旦选择了**缓冲区**工具,并在QGIS地图画布的右上角用鼠标点击定义了中心点,一个显示圆半径的部件就会出现。输入所需的半径,然后按**输入键**来创建圆。另外,也可以通过移动鼠标光标来手动绘制圆,在这种情况下,当前的半径将显示在同一个小部件中。
当多边形的数字化完成后,将显示一个自定义属性表格。
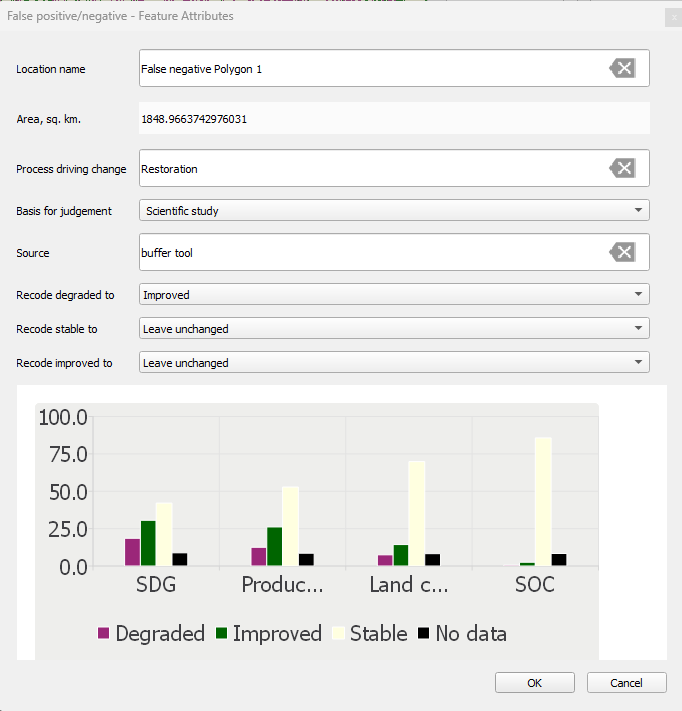
除了各种属性之外,这个表格还包含了根据步骤7中选择的栅格计算的指标图。