Computing Pyramids
When the raster file is too big, due to a large study area, high spatial resolution, or a large number of bands in the file, the data could take several seconds to display. If you change the zoom or turn layers on an off frequently, this could make the work a bit frustrating. An option to overcome this is to compute Pyramids to the file. This process will take from minutes to hours to run depending on the size of the area, so make sure to have enough time for it to process. To compute pyramids you have to:
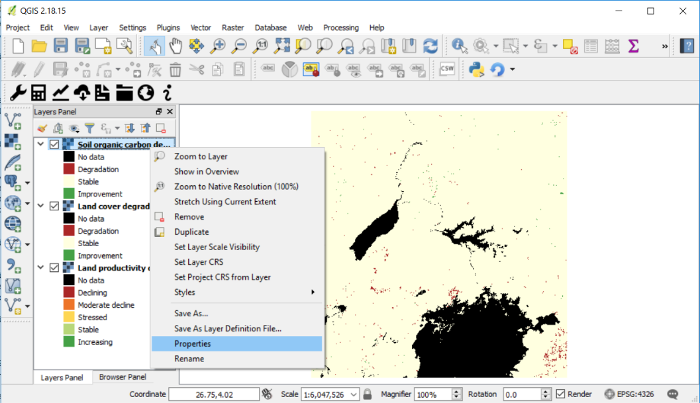
Navigate with your cursor to the layer you want to compute pyramids for and right click over it. A menu will open. Navigate to Properties and click on it.
Note
When using the Calculate all three sub-indicators in one step option (described in the tutorial Land Degradation), all the bands are stored in a single TIF file, so even though you see three layers loaded in the QGIS window, they all refer to the same file. This means that the pyramids need to be computed only once for the three sub-indicators.
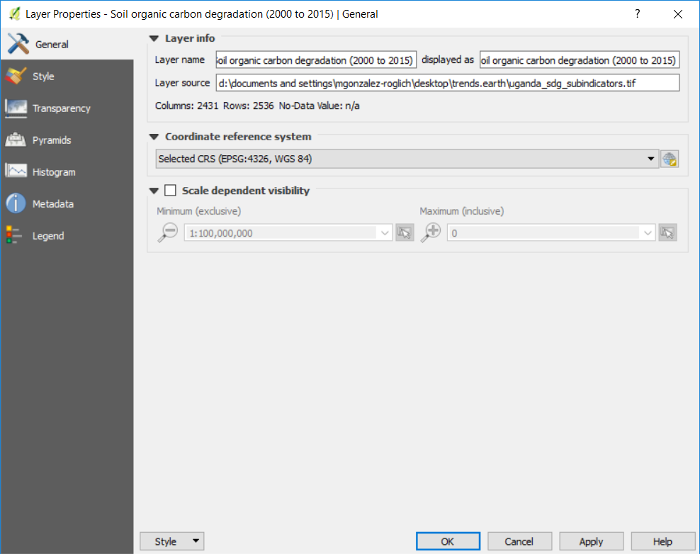
The Layer Properties menu will open. From the options on the left, navigate to Pyramids and click on it.
Once on the Pyramids tab you will see a description about they are.
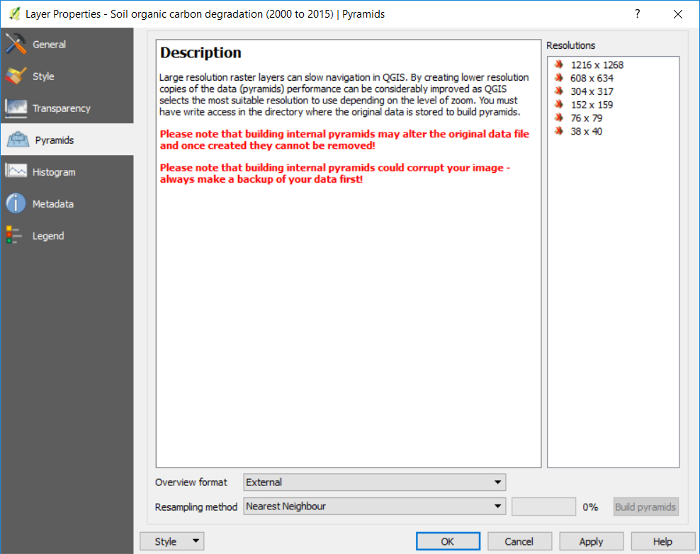
To the right of the window you will see the Resolutions options. Selecting all of them will make displaying in QGIS the fastest, but this could take hours to compute depending on the file size and processing capabilities of the computer you are using. For the Uganda example, we can select them all, but if using a larger area or higher spatial resolution than the default 250m, we recommend you select alternating resolutions options (i.e. one resolution selected and one not selected, and so on). Resolutions are selected by clicking on them. When selected, they will turn blue.
Make sure that the settings at the bottom are set to:
Overview format: External
Resampling method: Nearest Neighbour
Then click on the Build pyramids button. The progress bar next to it will show which percentage of the task has been completed.
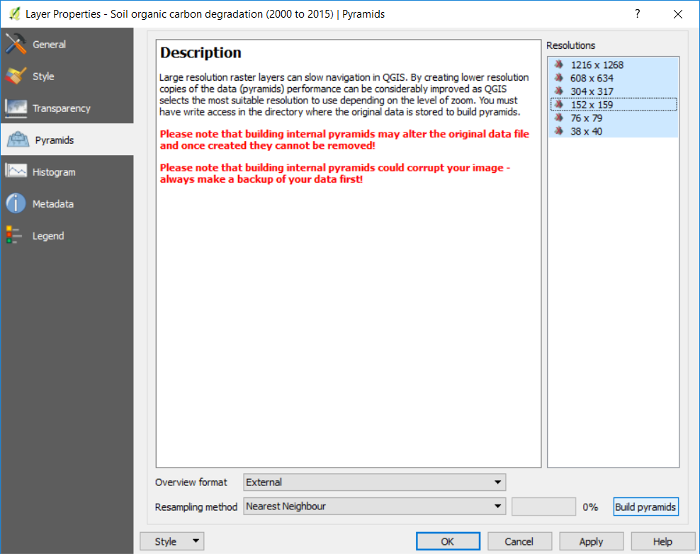
When pyramids have been built you will notice that the icons next to the resolutions will have changed from red crosses to yellow pyramids.
Click OK to go back to the QGIS main interface.