Forest and Carbon Change Tool
Objective: Learn how to compute forest cover, forest loss, above and below ground biomass and emissions from deforestation in raster format and tabular outputs with areas estimated.
Estimated time of completion: 20 minutes
Internet access: Required
Note
- Refer to the Carbon emissions from deforestation for background information on the datasets and
methodology used for this tutorial.
Calculate change in carbon
In the Algorithms tab in Trends.Earth plugin in QGIS, under the Experimental menu, select Calculate change in total carbon - Above and below ground emissions, and deforestation menu.
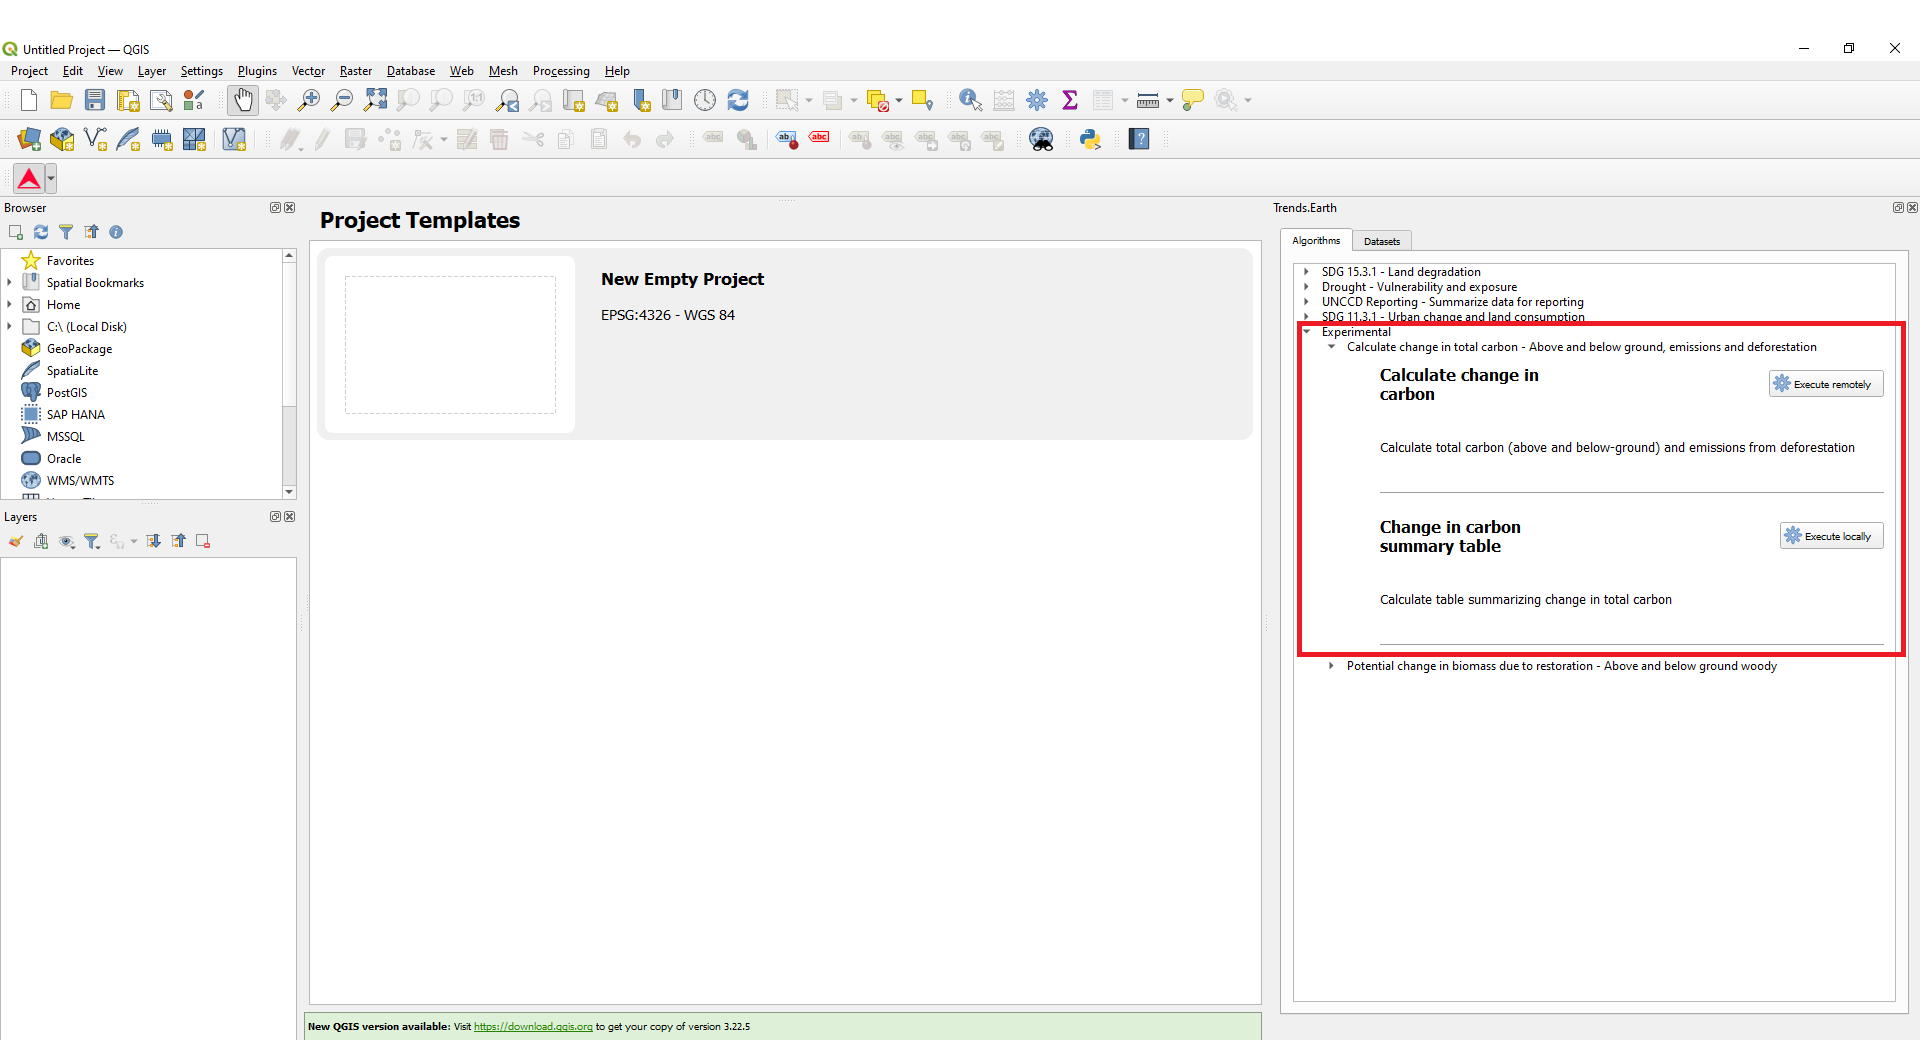
Select the Calculate change in carbon menu by selecting Execute locally.
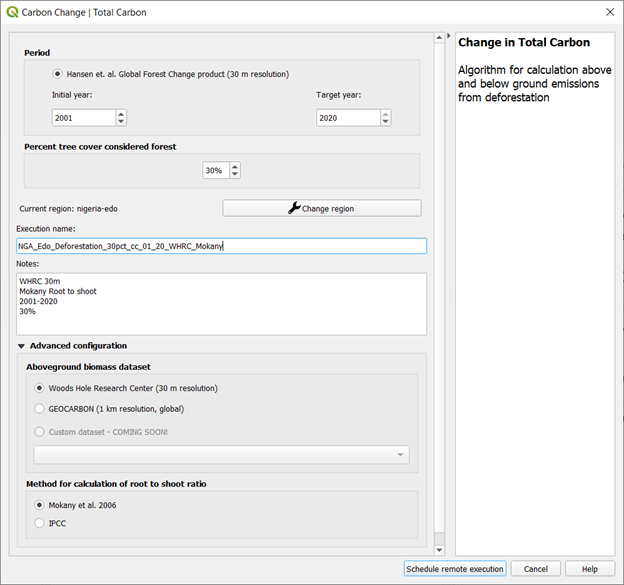
A window will appear where you can select the paramaters for the carbon analysis. Select the initial and target years for monitoring tree cover loss, carbon emissions from deforestation. Define the percent tree cover considered forest for your area of interest.
Note
- The definition of canopy cover should be changed to accommodate the specific area of interest.
The dataset maps global tree cover based on percent canopy cover in the year 2000. Many studies cite 25% - 30% threshold to define forest, however this definition can change for arid regions. For more information, please see the publication”
Select Change region to define the area of interest.

Note
The geoBoundaries Administrative Boundaries provided in Trends.Earth are under the CC BY 4.0 license. The boundaries and names used, and the designations used, in Trends.Earth do not imply official endorsement or acceptance by Conservation International Foundation, or by its partner organizations and contributors.
If using Trends.Earth for official purposes, it is recommended that users choose an official boundary provided by the designated office of their country.
Use your own area file: If you want to use your own area of analysis, make sure the Area from file option is highlighted. Then click Browse and navigate to the folder in your computer where you have the file stored.
Add a descriptive name and notes for the analysis
Select the Advanced configuration menu to select the biomass dataset, and method for calculating the root to shoot ratio (below ground biomass) Select Schedule remote exectution
A light blue bar will temporarily show, indicating that the task was successfully submitted. The analysis will be run in Google servers and could take between 5 and 15 minutes depending on the size of the study area (larger areas tend to take longer).
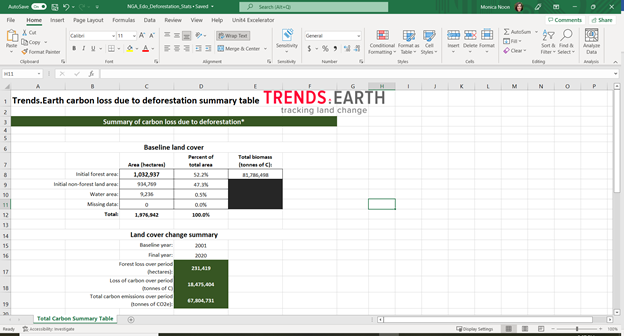
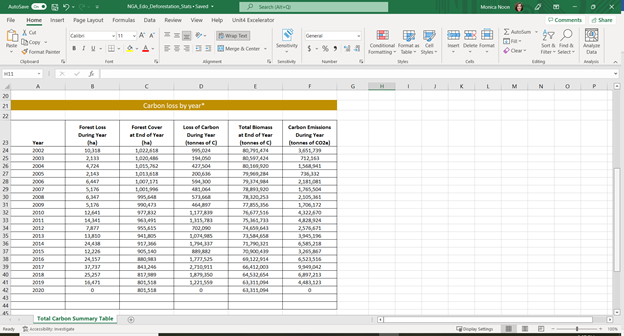
Change in carbon summary table
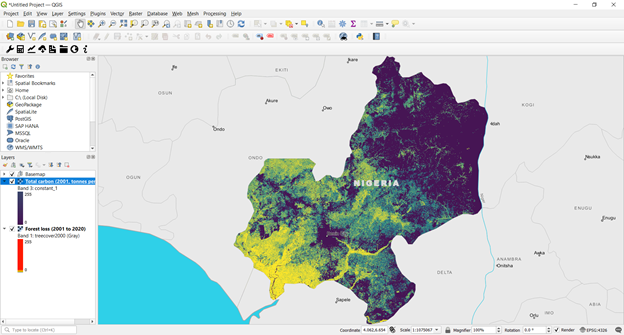
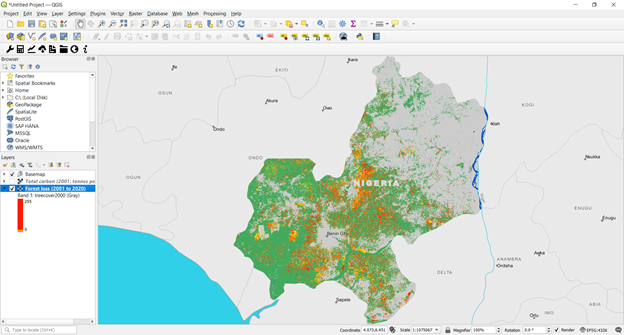
Go the the Datasets tab to Add default layers from this dataset to map.
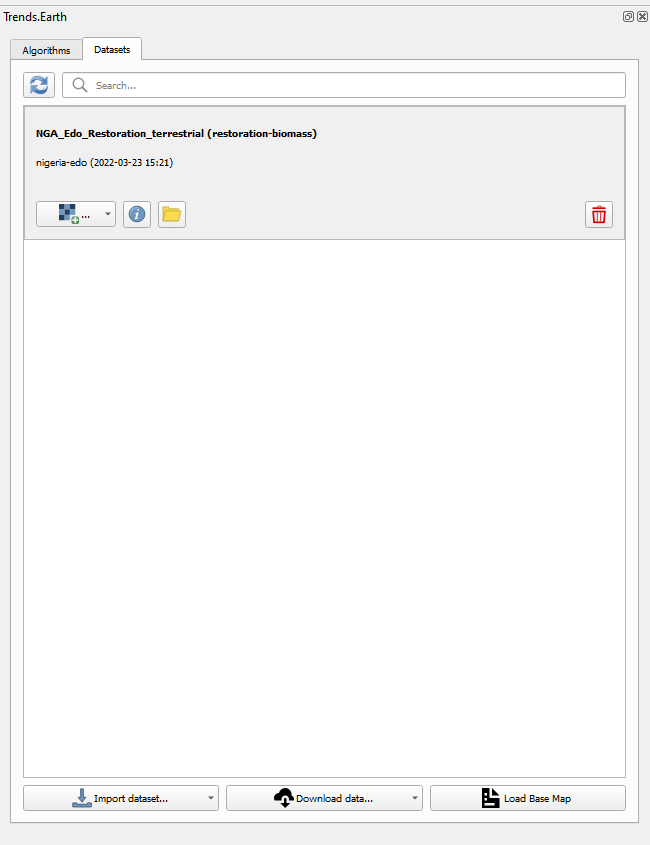
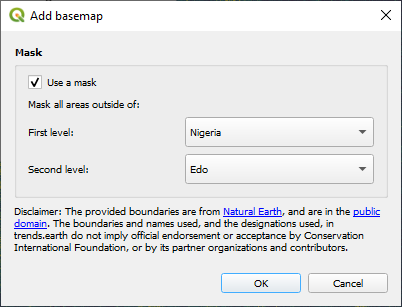
In order to view the defined area of interest with reference data, select the Load Base Map in the Datasets tab.
In the Calculate change in total carbon - Above and below ground emissions, and deforestation menu under Change in carbon summary table, select the Execute locally button.
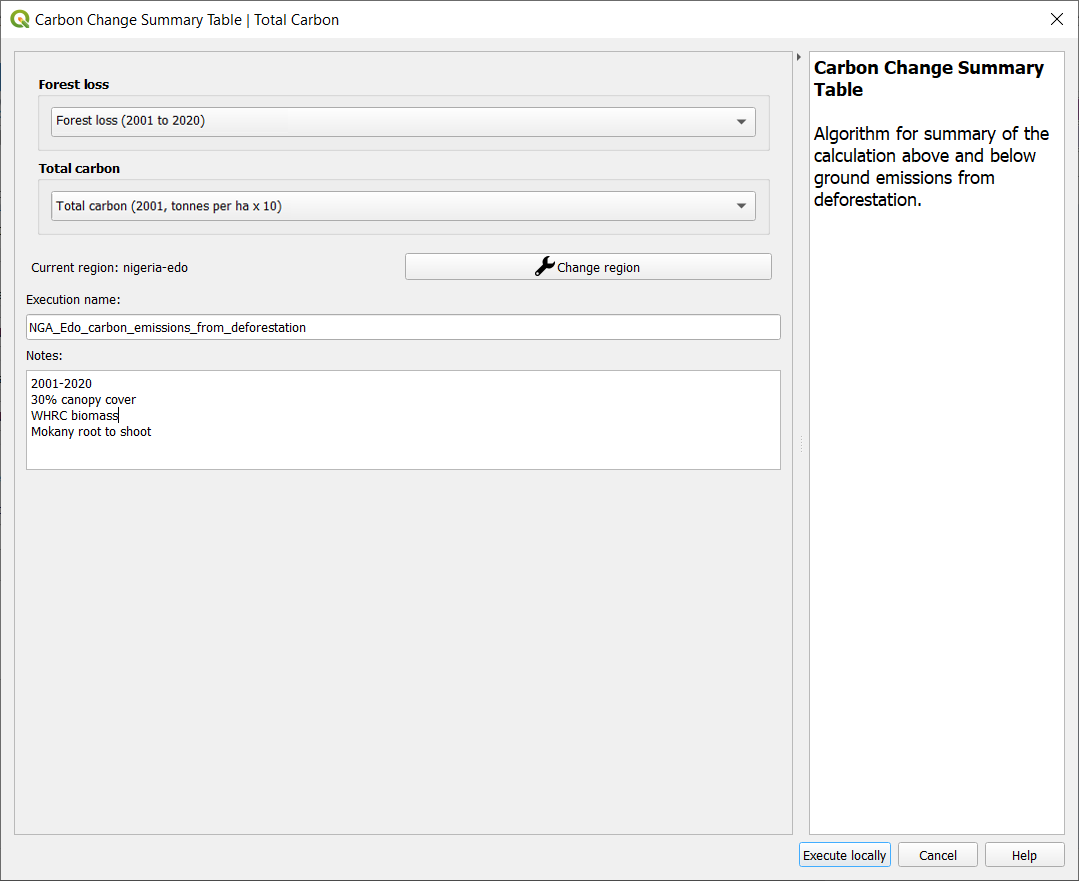
- The layers will pre-populate in the data layer drop-down lists. Confirm the region is the same area of interest, provide descriptive names and notes and select Execute locally.
A spreadsheet comparing the final outputs is saved in your trends_earth_data* folder under your user account on your computer (e.g., C:Usersmnoontrends_earth_data).