Development
![]() is free and open-source software, licensed under the GNU
General Public License, version 2.0 or later.
is free and open-source software, licensed under the GNU
General Public License, version 2.0 or later.
There are a number of components to the ![]() tool. The first is a
QGIS plugin supporting calculation of indicators, access to raw data,
reporting, and production of print maps . The code for the plugin, and further
instructions on installing it if you want to modify the code, are in
trends.earth
GitHub repository.
tool. The first is a
QGIS plugin supporting calculation of indicators, access to raw data,
reporting, and production of print maps . The code for the plugin, and further
instructions on installing it if you want to modify the code, are in
trends.earth
GitHub repository.
The ![]() QGIS plugin is supported by a number of different Python
scripts that allow calculation of the various indicators on Google Earth Engine
(GEE). These scripts sit in the “gee” sub-folder of that GitHub repository. The
GEE scripts are supported by the landdegradation Python module, which
includes code for processing inputs and outputs for the plugin, as well as
other common functions supporting calculation of NDVI integrals, statistical
significance, and other shared code. The code for this module is available in
the landdegradation repository on
GitHub.
QGIS plugin is supported by a number of different Python
scripts that allow calculation of the various indicators on Google Earth Engine
(GEE). These scripts sit in the “gee” sub-folder of that GitHub repository. The
GEE scripts are supported by the landdegradation Python module, which
includes code for processing inputs and outputs for the plugin, as well as
other common functions supporting calculation of NDVI integrals, statistical
significance, and other shared code. The code for this module is available in
the landdegradation repository on
GitHub.
Further details are below on how to contribute to Trends.Earth by working on the plugin code, by modifying the processing code, or by contributing to translating the website and plugin.
Modifying the QGIS Plugin code
Downloading the trends.earth code
The Trends.Earth code for both the plugin and the Google Earth Engine scripts that support it are located on GitHub in the trends.earth repository. Clone this repository to a convenient place on your machine in order to ensure you have the latest version of the code.
There are a number of different branches of the trends.earth repository that are under active development. The plugin officially supports QGIS3 and the majority of development is occurring on the “develop” branch. The “qgis2” branch is the older version of the plugin, and supports QGIS2 version 2.18+.
Installing dependencies
Python
The plugin is coded in Python. In addition to being used to run the plugin through QGIS, Python is also used to support managing the plugin (changing the version, installing development versions, etc.). Though Python is included with QGIS, you will also need a local version of Python that you can setup with the software needed to manage the plugin. The easiest way to manage multiple versions of Python is through the Anaconda distribution. For work developing the plugin, Python 3 is required. To download Python 3.7 (recommended) though Anaconda, see this page.
Python dependencies
In order to work with the trends.earth code, you need to have Invoke installed on your machine, as well as a number of other packages that are used for managing the documentation, translations, etc. These packages are all listed in the “dev” requirements file for Trends.Earth, so they can be installed by navigating in a command prompt to the root of the trends.earth code folder and typing:
pip install -r requirements-dev.txt
Note
If you are using Anaconda, you will first want to activate a Python 3.7 virtual environment before running the above command (and any of the other invoke commands listed on the page). One way to do this is by starting an “Anaconda prompt”, by following the instructions on this Anaconda page.
PyQt
PyQt5 is the graphics toolkit used by QGIS3. To compile the user interface for Trends.Earth for QGIS3 you need to install PyQt5. This package can be installed from pip using:
pip install PyQt5
Note
PyQt4 is the graphics toolkit used by QGIS2. The best source for this package on Windows is from the set of packages maintained by Christoph Gohlke at UC Irvine. To download PyQt4, select the appropriate package from this page. Choose the appropriate file for the version of Python you are using. For example, if you are using Python 2.7, choose the version with “cp27” in the filename. If you are using Python 3.7, choose the version with “cp37” in the filename. Choose “amd64” for 64-bit python, and “win32” for 32-bit python.
After downloading from the above link, use pip to install it. For example,
for the 64-bit wheel for Python 3.7, you would run:
pip install PyQt4-4.11.4-cp37-cp37m-win_amd64.whl
Changing the version of the plugin
The convention for Trends.Earth is that version numbers ending in an odd number (for example 0.65) are development versions, while versions ending in an even number (for example (0.66) are release versions. Development versions of the plugin are never released via the QGIS repository, so they are never seen by normal users of the plugin. Odd-numbered development versions are used by the Trends.Earth development team while testing new features prior to their public release.
If you wish to make changes to the code and have downloaded a public release of the plugin (one ending in an even number), the first step is to update the version of the plugin to the next sequential odd number. So, for example, if you downloaded version 0.66 of the plugin, you would need to update the version to be 0.67 before you started making your changes. There are several places in the code where the version is mentioned (as well as within every GEE script) so there is an invoke task to assist with changing the version. To change the version to be 0.67, you would run:
invoke set-version -v 0.67
Running the above command will update the version number every place it is referenced in the code. To avoid confusion, never change the version to one that has already been released - always INCREASE the value of the version tag to the next odd number.
Testing changes to the plugin
After making changes to the plugin code, you will need to test them to ensure the plugin behaves as expected, and to ensure no bugs or errors come up. The plugin should go through extensive testing before it is released to the QGIS repository (where it can be accessed by other users) to ensure that any changes to the code do not break the plugin.
To test any changes that you have made to the plugin within QGIS, you will need to install it locally. There are invoke tasks that assist with this process. The first step prior to installing the plugin is ensuring that you have setup the plugin with all of the dependencies that it needs in order to run from within QGIS. To do this, run:
invoke plugin-setup
The above task only needs to be run immediately after downloading the
trends.earth code, or if any changes are made to the dependencies for the
plugin. By default plugin-setup will re-use any cached files on your
machine. To start from scratch, add the -c (clean) flag to the above
command.
After running plugin-setup, you are ready to install the plugin to the QGIS
plugins folder on your machine. To do this, run:
invoke plugin-install
After running the above command, you will need to either 1) restart QGIS, or 2) use the Plugin Reloader to reload the Trends.Earth plugin in order to see the effects of the changes you have made.
By default plugin-install will overwrite any existing plugin files on your
machine, but leave in place any data (administrative boundaries, etc.) that the
plugin might have downloaded. To start from scratch, add the -c (clean)
flag to the above command. You may need to close QGIS in order to successfully
perform a clean install of the plugin using the -c flag.
Note
By default plugin-install assumes you want to install the plugin to be used
in QGIS3. To install the plugin for use in QGIS3, add the flag -v 2 to
the plugin-install command. Remember the plugin may or may not be
entirely functional on QGIS3 - the plugin was originally designed for QGIS2
and is still being tested on QGIS3.
Syncing and deploying changes to the binaries
To speed the computations in Trends.Earth, some of the tools allow making use of pre-compiled binaries that have been compiled using numba. Numba is an open source compiler that can compile Python and NumPy code, making it faster than when it is run as ordinary Python. To avoid users of Trends.Earth needing to download Numba and all of its dependencies, the Trends.Earth team makes pre-compiled binaries available for download if users choose to install them.
To generate pre-compiled binaries for the OS, bitness (32/64 bit) and Python version you are running on your machine, use:
invoke binaries-compile
Note
You will need a C++ compiler for the above command to work. On Windows, see this github page for details on how to install the Microsoft Visual C++ compiler needed for you Python version. On MacOS, you will most likely need to install Xcode. On Linux, install the appropriate version of GCC.
To make binaries publicly available, they are distributed through an Amazon Web services S3 bucket. To upload the binaries generated with the above command to the bucket, run:
invoke binaries-sync
Note
The above command will fail if you do not have keys allowing write
access to the trends.earth bucket on S3.
The above command will sync each individual binary file to S3. However, users of the toolbox download the binaries as a single zipfile tied to the version of the plugin that they are using. To generate that zipfile so that it can be accessed by Trends.Earth users, run:
invoke binaries-deploy
Note
The above command will fail if you do not have keys allowing write
access to the trends.earth bucket on S3.
Building a plugin ZIP file
There are several invoke tasks to help with building a ZIP file to deploy the plugin to the QGIS repository, or to share the development version of the plugin with others. To package the plugin and all of its dependencies into a ZIP file that can be installed following the process described in the Trends.Earth readme, run:
invoke zipfile-build
This command will create a folder named build at the root of the
trends.earth code folder, and in that folder it will create a file called
LDMP.zip. This file can be shared with others, who can use it to manually
install Trends.Earth.
This can be useful if there is a need to share the latest features with someone
before they are available in the publicly released version of the plugin.
Deploying the development version ZIP file
The Trends.Earth GitHub page gives a link a ZIP file that allows users who may not be developers to access the development version of Trends.Earth. To create a ZIP file and make it available on that page (the ZIP file is stored on S3), run:
invoke zipfile-deploy
This command will package the plugin and copy it to https://s3.amazonaws.com/trends.earth/sharing/LDMP.zip.
Note
The above command will fail if you do not have keys allowing write
access to the trends.earth bucket on S3.
Modifying the Earth Engine processing code
The Google Earth Engine (GEE) processing scripts used by Trends.Earth are all stored in the “gee” folder under the main trends.earth folder. For these script to be accessible to users of the trends.earth QGIS plugin, they have to be deployed to the api.trends.earth service Conservation International maintains in order to allow users of the plugin to use Earth Engine without the need to know how to program, or to have individual user accounts on GEE. The below describes how to test and deploy GEE scripts to be used with Trends.Earth.
Setting up dependencies
trends.earth-CLI
The “trends.earth-CLI” Python package is required in order to work with the api.trends.earth server. This package is located on GitHub in the trends.earth-CLI repository.
The first step is to clone this repository onto your machine. We recommend that you clone the repository into the same folder where you the trends.earth code. For example, if you had a “Code” folder on your machine, clone both the trends.earth repository (the code for the QGIS plugin and associated GEE scripts) and also the trends.earth-CLI repository into that same folder.
When you setup your system as recommended above, trends.earth-CLI will work with the invoke tasks used to manage trends.earth without any modifications. If, however, you download trends.earth-CLI into a different folder, then you will need to add a file named “invoke.yaml” file into the root of the trends.earth repository, and in that file tell Trends.Earth where to locate the trends.earth-CLI code. This YAML file should look something like the below (if you downloaded the code on Windows into a folder called “C:/Users/azvol/Code/trends.earth-CLI/tecli”):
gee:
    tecli: "C:/Users/azvol/Code/trends.earth-CLI/tecli"
Again, you do not need to add this .yaml file if you setup your system as recommended above.
docker
The trends.earth-CLI package requires docker in order to function. Follow these instructions to install docker on Windows, and these instructions to install docker on Mac OS. If you are running Linux, follow the instructions on this page that are appropriate for the Linux distribution you are using.
Testing an Earth Engine script locally
After installing the trends.earth-CLI package, you will need to setup a .tecli.yml file with an access token to a GEE service account in order to test scripts on GEE. To setup the GEE service account for tecli, first obtain the key for your service account in JSON format (from the google cloud console), then and encode it in base64. Provide that base64 encoded key to tecli with the following command:
invoke tecli-config set EE_SERVICE_ACCOUNT_JSON key
where “key” is the base64 encoded JSON format service account key.
While converting a script specifying code to be run on GEE from JavaScript to
Python, or when making modifications to that code, it can be useful to test the
script locally, without deploying it to the api.trends.earth server. To do
this, use the run invoke task. For example, to test the “land_cover”
script, go to the root directory of the Trends.Earth code, and, in a command
prompt, run:
invoke tecli-run land_cover
This will use the trends.earth-CLI package to build and run a docker container
that will attempt to run the “land_cover” script. If there are any syntax
errors in the script, these will show up when the container is run. Before
submitting a new script to api.trends.earth, always make sure that invoke
tecli-run is able to run the script without any errors.
When using invoke tecli-run you may get an error saying:
Invalid JWT: Token must be a short-lived token (60 minutes) and in a
reasonable timeframe. Check your iat and exp values and use a clock with
skew to account for clock differences between systems.
This error can be caused if the clock on the docker container gets out of sync with the system clock. Restarting docker should fix this error.
Deploying a GEE script to api.trends.earth
When you have finished testing a GEE script and would like it to be accessible using the QGIS plugin (and by other users of Trends.Earth), you can deploy it to the api.trends.earth server. The first step in the process is logging in to the api.trends.earth server. To login, run:
invoke tecli-login
You will be asked for a username and password. These are the same as the username and password that you use to login to the Trends.Earth server from the QGIS plugin. If you are not an administrator, you will be able to login, but the below command will fail. To upload a script (for example, the “land_cover” script) to the server, run:
invoke tecli-publish -s land_cover
If this script already exists on the server, you will be asked if you want to overwrite the existing script. Be very careful uploading scripts with even-numbered versions, as these are publicly available scripts, and any errors that you make will affect anyone using the plugin. Whenever you are testing be sure to use development version numbers (odd version numbers).
After publishing a script to the server, you can use the tecli-info task to check the status of the script (to know whether it deployed successfully - though note building the script may take a few minutes). To check the status, of a deployed script, run:
invoke tecli-publish -s land_cover
If you are making a new release of the plugin, and want to upload ALL of the GEE scripts at once (this is necessary whenever the plugin version number changes), run:
invoke tecli-publish
Again - never run the above on a publicly released version of the plugin unless you are intending to overwrite all the publicly available scripts used by the plugin.
Editing vector layer templates
Trends.Earth allow users to digitize new vector features to delineate areas of special interest.
For now only “false positive/negative” layers are supported, but more
can be added if necessary. Any vector layer is created from the
template GeoPackage files, which can be found inside the data/error_recode
folder of the plugin installation directory. For each vector type
there are 6 template files, one for each UN official language. The ISO
language code is added as a suffix to the file name. This is necessary to
provide localized labels in the attribute forms. When creation of the
vector layer is requested QGIS will look for the template file
taking QGIS locale into accont, as a fall-back option English version
of the template file is used.
To change schema of the layer it is necessary to change corresponding
template files in the data/error_recode folder of the plugin
installation directory. Also template file contains a buil-in default
styling and attribute form configuration which will be automatically
applied to the layer when loading into QGIS.
To display charts in the attribute form a built-in QML widget is used. Data for charts are stored in the vector layer attribute table. Values from the corresponding fields extracted with the help of expressions.
The code to generate charts looks like this:
import QtQuick 2.0
import QtCharts 2.0

ChartView {
    width: 380
    height:200
    margins {top: 0; bottom: 0; left: 0; right: 0}
    backgroundColor: "#eeeeec"
    legend.alignment: Qt.AlignBottom
    antialiasing: true
    ValueAxis {
        id: valueAxisY
        min: 0
        max: 100
    }

    BarSeries {
        id: mySeries
        axisY: valueAxisY
        axisX: BarCategoryAxis { categories: ["Productivity", "Land cover", "Soil organic carbon"] }
        BarSet { label: "Degraded"; color: "#9b2779"; values: [expression.evaluate("\"prod_deg\""), expression.evaluate("\"land_deg\""), expression.evaluate("\"soil_deg\"")] }
        BarSet { label: "Improved"; color: "#006500"; values: [expression.evaluate("\"prod_imp\""), expression.evaluate("\"land_imp\""), expression.evaluate("\"soil_imp\"")] }
        BarSet { label: "Stable"; color: "#ffffe0"; values: [expression.evaluate("\"prod_stab\""), expression.evaluate("\"land_stab\""), expression.evaluate("\"soil_stab\"")] }
    }
}
To extract field value function expression.evaluate("\"prod_deg\"")
is used, the only argument it accepts is the name of the field. For
false positive/negative layers chart contains three indicators:
productivity, land cover and soil organic carbon. For each indicator
plugin keeps three values stable, degraded and improved percentage of
the polygon area. For example, in case of productivity indicator fields
will be:
prod_deg - degraded productivity
prod_stab - stable productivity
prod_imp - improved productivity
The same naming approach is applied to land cover (land_* fields)
and soil organic carbon (soil_* fields).
Calculation of area percentage is done with custom expression function,
its code can be found in the file charts.py in the plugin root
directory. Function optimized to work with large polygons and uses
following workflow. For a given geometry find a bbox and extract raster
susbset using this bbox. Perform in-memory geometry rasterization and
apply it as a mask to raster. Then count number of pixels which have
specific value and calculate percentage. As pixel counting is built
on numpy array functions it is very fast even for big polygons.
On the first attempt to edit a vector layer the user will be presented with a dialog where they should select which datasets to use for indicators. Then plugin will setup default expression values for all indicator fields, so the value will be updated on every geometry change.
Dataset metadata handling
Dataset metadata are stored in the QGIS QMD format. These QMD files can be created for each raster individually and also for the whole dataset. Metadata editor dialog is opened from the Edit metadata menu in the Trends.Earth dock.
When dataset is exported to ZIP, conversion to ISO XML is performed using
XSLT transformation. Corresponding transformation are located in the data\xsl
subdirectory of the plugin installation folder.
Updating the Reporting Framework
Overview of the Reporting Framework
The Reports Framework is designed to be extensible while also providing interactivity to the user through
non-blocking operations. The Framework heavily leverages on QgsProject and QgsPrintLayout classes
which are not thread safe hence, the use of qgis_process to do the heavy lifting of generating the reports
(and charts). You can find more information about qgis_process here.
There are two main steps the toolbox performs when generating reports (and charts) for the default layers in a job:
It creates a
ReportTaskContextobject that constitutes aReportConfigurationobject (see Configuring Report Parameters) and aJobobject that is represented in the Datasets panel. ThisReportTaskContextobject is serialized to a JSON file and then passed as one of the arguments in aReportProcessHandlerTaskobject (that inherits from QgsTask).The
ReportProcessHandlerTaskobject initiates a separate instance ofqgis_processand passes the path to the JSON file as an input totrendsearth:reporttaskprocessing algorithm. This is a thin wrapper that deserializes the file to theReportTaskContextobject and passes it to aReportTaskProcessorobject that is responsible for generating the reports and the job’s QGIS project. For algorithms that require charts, theReportTaskProcessorobject passes the job object to aAlgorithmChartsManagerobject which checks whether there is a chart configuration defined for the job’s algorithm. If defined, it generates the corresponding charts as PNG files. (See Adding Chart Configurations for more information about chart configurations)
The diagram below provides a high-level illustration of this process:
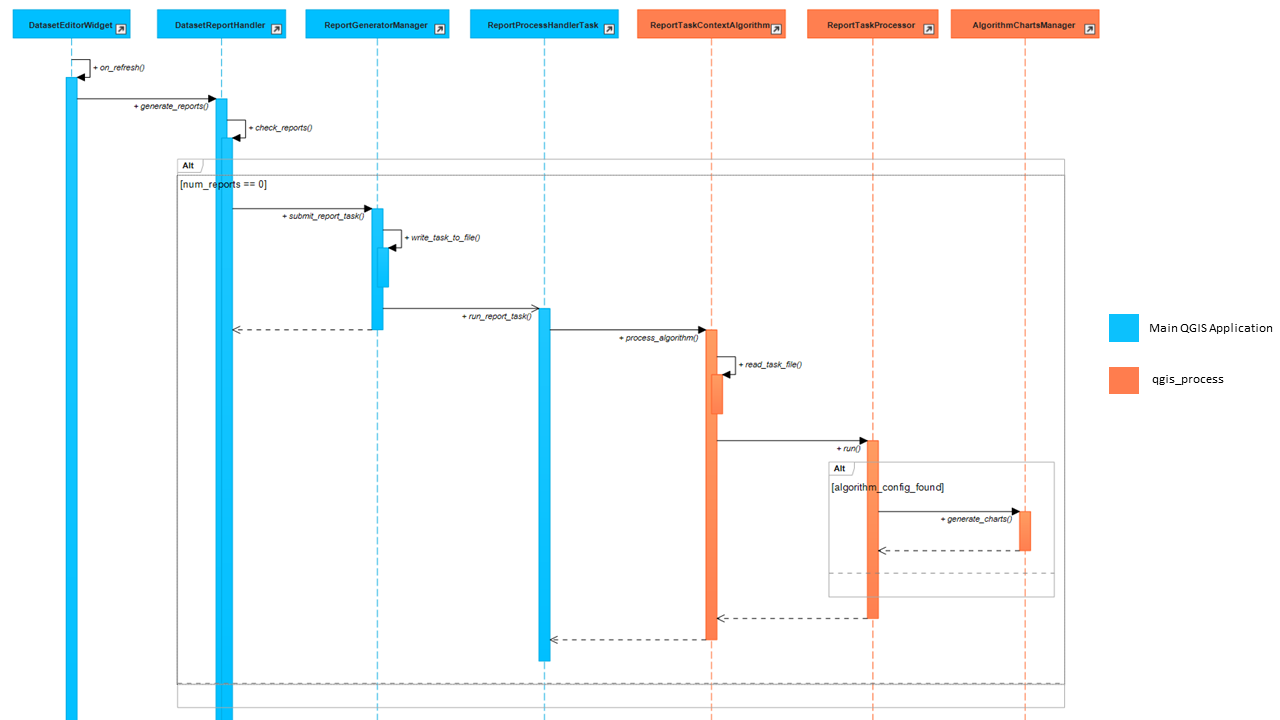
* Click on the image for an enlarged view.
Note
Some of the function names in the diagram above have been simplified for illustration purposes. The aforementioned classes can be found in the LDMP.reports and LDMP.processing_provider.report modules.
Adding Report Layout Variables
Report variables provide context information related to a job, layer (or band) or Reports during the report execution process. Currently, the toolbox supports variables listed in the Layout Expression Variables section.
Each variable is defined as a namedtuple in the LDMP.reports.expressions
module and, is subsequently updated and evaluated by the ReportTaskProcessor object.
Follow the guidelines below on how to add new job or current layer variables.
Job Variable
It enables information about the current job - being executed - to be added to a report layout. Information about each
job variable is encapsulated in a JobAttrVarInfo object that is made up of four attributes:
Attribute Name |
Description |
Data Type |
Default Value |
|---|---|---|---|
job_attr |
Attribute name of a |
String |
N/A |
var_name |
Name of the report layout variable. It should be prefixed with te_job_. |
String |
N/A |
default_value |
A default value to use for var_name, mostly applied when designing layouts. |
object |
object |
fmt_func |
A function object that will be used to convert the job’s
attribute value to a format that is compatible with QGIS
expressions.
For instance, |
function object |
None |
The code snippet below shows how to add a variable te_job_result_name that corresponds to
job.results.name.
# LDMP/reports/expressions.py
def _job_attr_var_mapping() -> typing.List[JobAttrVarInfo]:
    return [
        ...
        JobAttrVarInfo('results.name', 'te_job_result_name', '', str),
        ...
    ]
Layer Variable
It provides information about the current raster layer being executed. This variable information is encapsulated in
a LayerVarInfo object that is made up of three attributes:
Attribute Name |
Description |
Data Type |
Default Value |
|---|---|---|---|
var_name |
Name of the report layout variable. It should be prefixed with te_current_layer_. |
String |
N/A |
default_value |
A default value to use for var_name, mostly applied when designing layouts. |
object |
object |
fmt_func |
A function object that will be used to extract and/or convert a value from a QgsRasterLayer object to a format that is compatible with QGIS expressions. You can also use lambda functions here. For instance, |
function object |
None |
The code snippet below shows how to add a variable te_current_layer_height that corresponds to the raster layer’s height.
# LDMP/reports/expressions.py
def _current_job_layer_var_mapping() -> typing.List[LayerVarInfo]:
    return [
        ...
        LayerVarInfo(
            'te_current_layer_height',
            '',
            lambda layer: layer.height()
        )
        ...
    ]
Note
These variables are only available in the layout scope.
Adding Chart Configurations
Charts can be grouped using a chart configuration object that corresponds to a specific algorithm. Defining a new chart configuration is a three-step process:
Create a new chart class that inherits from
BaseChartin the LDMP.reports.charts module. Implement theexportfunction to specify the chart type, properties etc. using thePlotlyPython library that ships with QGIS. Finally, within theexportfunction, call thesave_imagefunction to write the Plotly’sFigureobject as an image file using any of the formats supported by Qt’sQImageWriterclass. You can also specify the path as relative to the root output directory which is also available as an attribute in the base class. See the code snippet below:# LDMP/reports/charts.py Class MyCustomChart(BaseChart): def export(self) -> typing.Tuple[bool, list]: status = True messages = [] # Create chart Figure using Plotly and set properties fig = go.Figure(...) # Add warning or error messages messages.append('Colour list not supported.') # Set image path in dataset's reports folder img_path = f'{self.root_output_dir}/chart-NDVI.png' # Save image and append its path self.save_image(fig, img_path) self._paths.append(img_path) return status, messages
You can refer to the
UniqueValuesPieChartclass for a more complete example.Create a chart configuration class that inherits from
BaseAlgorithmChartsConfigurationand implement the_add_chartsfunction. The chart configuration class basically defines which charts will be used for a given algorithm. Thelayer_band_infosattribute is a list ofLayerBandInfoobjects that contains the layer and band_info data required to produce the charts. You can refer to theLandCoverChartsConfigurationclass for a more complete example.Finally, map an algorithm (name) to the correspond chart configuration class in the
AlgorithmChartsManagerclass as shown below:# LDMP/reports/charts.py Class AlgorithmChartsManager: def _set_default_chart_config_types(self): ... self.add_alg_chart_config('land-cover', LandCoverChartsConfiguration) self.add_alg_chart_config('productivity', MyCustomLandProductivityChartsConfiguration) ...
The
AlgorithmChartsManagerclass, which is instantiated in theReportTaskProcessorobject, will create a new chart configuration object for a corresponding job’s algorithm when reports are being generated.
Contributing to the documentation
Overview
The documentation for Trends.Earth is produced using Sphinx, and is written in reStructuredText format. If you are unfamiliar with either of these tools, see their documentation for more information on how they are used.
The documentation for Trends.Earth is stored in the “docs” folder under the main trends.earth directory. Within that folder there are a number of key files and folders to be aware of:
build: contains the build documentation for trends.earth (in PDF and HTML format). Note it will only appear on your machine after running the
docs-buildinvoke task.i18n: contains translations of the documentation into other languages. The files in here are normally processed automatically using invoke tasks, so you shouldn’t ever have reason to modify anything in this folder.
resources: contains any resources (primarily images or PDFs) that are referred to in the documentation. Currently there is only one folder (“EN”, for English) as all of the images in the documentation are from the English version of the plugin - if appropriate additional folders can be added under “resources” with two-letter language codes to include images specific to a particular language.
source: contains the reStructuredText source files that define the documentation (these are the actual English text of the documentation, and are the files you are most likely to need to modify).
Installing dependencies
Python dependencies
In order to work with the documentation, you need to have invoke, Sphinx, sphinx-intl, and sphinx-rtd-theme (the theme for the Trends.Earth website) installed on your machine. These packages are all listed in the “dev” requirements file for Trends.Earth, so they can be installed by navigating in a command prompt to the root of the trends.earth code folder and typing:
pip install -r requirements-dev.txt
LaTeX
LaTeX is used to produce PDF outputs of the documentation for Trends.Earth.
To install on Windows, follow the process outlined here to install the proTeXt distribution of LaTeX from the zipfile available here. The LaTeX installer is quite large (several GB) so it might take some time to download and install.
On MacOS, MacTeX is a good option, and can be installed following the instructions here.
On Linux, installing LaTeX should be much easier - use your distribution’s package manager to find and install whatever LaTeX distribution is included by default.
Qt Linguist
Qt Linguist is also needed in order to pull strings from the code and GUI for translation. The “lrelease” command must be available and on your path. Try trying:
lrelease
within a terminal window. If the file is not found, you’ll need to install Qt Linguist. This page is one source of installers for Qt Linguist. Once you install Qt Linguist ensure you add the folder containing lrelease to your path so that the Trends.Earth invoke script can find it.
Updating and building the documentation
Once you have installed the sphinx requirements, you are ready to begin
modifying the documentation. The files to modify are located under the
“docs\source” folder. After making any changes to these files, you will need
to build the documentation in order to view the results. There are two versions
of the Trends.Earth documentation: an HTML version (used for the website) and a
PDF version (for offline download). To build the documentation for
Trends.Earth, use the “docs-build” invoke task. By default, this task will
build the full documentation for Trends.Earth, in HTML and PDF, for all
supported languages. This can take some time to run (up to a few hours). If you
are just testing the results of some minor changes to the documentation, it is
usually best to use the -f option (for “fast”). This
option will build only the English HTML documentation, which should take only a
few seconds. To build using the fast option, run:
invoke docs-build -f
The above command will take a few seconds to run, and then if you look under “docs\build\html\en”, you will see the HTML version of the documentation. Load the “index.html” file in a web browser to see how it looks.
To build the full documentation, for all languages, in PDF and in HTML (remember this could take a few hours to complete), run:
invoke docs-build
After running the above command you will see (for English) the HTML documentation under “docs\build\html\en”, and the PDFs of the documentation under “docs\build\html\en\pdfs”.
If you want to test a specific language (when testing translations, for example), you can specify a two letter language code to only build the docs for that language. For example, to build the Spanish documentation only, run:
invoke docs-build -l es
Note that options can be combined, so you can use the fast option to build only the HTML version of the Spanish documentation by running:
invoke docs-build -f -l es
When building the full documentation for the website, it is a good idea to
first remove any old builds of the documentation, as they might contain files
that are no longer used in the updated documentation. To do this, use the
-c (clean) option:
invoke docs-build -c
In general, docs-build MUST complete without any errors if you are planning to
share the documentation or post it on the website. However, when testing things
locally, you might want to ignore documentation errors that pop up only for
some of the languages (due to syntax errors arising from translation errors,
etc.), and continue building the remaining documentation regardless of whether
there are any errors. To do this, use the -i (ignore errors) option:
invoke docs-build -i
Whenever you make any changes to the text of the documentation, it is a good idea to push the latest strings to Transifex so they can be translated. To update the strings on Transifex with any new changes, run:
invoke translate-push
Note
To successfully run the above command you will need to have the key for the Trends.Earth transifex account.
Building documentation for release
Before releasing new documentation, always pull the latest translations from Transifex so that all translations are up to date. To do this, run:
invoke translate-pull
To build a version of the documentation for public release (either to the
website, or in PDF) you must build the entire documentation using
docs-build with no additional parameters:
invoke docs-build
This process must complete successfully with no errors. If any errors occur during the process, review the error message, and make any modifications needed to allow the build to complete successfully. Once the build completes with no errors, the files are ready to be deployed on the website.
Note
Both of the above commands also have -f (force) options that
force pulling or pushing the latest translations from or to Transifex
(respectively). Only use these options if you are VERY sure of what you are
doing, as they can completely overwrite the translations on Transifex,
leading to lost work done by the translators if the latest translations have
not yet been committed to github.
Adding new documentation text
Any new .rst files that are added to the documentation need to be added to several configuration files to ensure they appear in the navigation menu, that they are properly translated, and (for tutorials) to ensure that they are generated in PDF so they can be downloaded for offline use.
docs\source\index.rst: add new .rst files in the appropriate place here to ensure that they are linked to from the navigation menu.
.tx\config: list new .rst files here (in the same format as the other files already included) in order to make the translation software aware of them so that they can be translated
docs\source\conf.py: if you want to generate a PDF file of page of the website, then you must list that page here in the
latex_documentslist. Usually we do this only for tutorial pages that we want to make available to workshop participants in individual PDFs. Every page on the site will be included in the PDF version of the website as a whole, regardless of whether it is in thelatex_documentslist.
Adding new images or other resources
Any new images or other resources (PDFs, etc.) that are needed by the documentation should be added under “docs\resources\en”. If desired, it is possible to upload different versions of an image so that the image appears with the proper translations. This could be useful if you want to show the GUI interface in the appropriate language, for example. to do this, first upload a copy of the image to “docs\resourcesen” (with English text in it). Then, create a copy of the image with translated text and place that image under the appropriate folder for that language (for example an image showing Spanish translations would go under “docs\resources\es”). The English version of the image will be used as the default for all languages for which a native version of the image is not provided, while a localized version will be used when available.
Note
There is another folder, docs\\source\\static, that is used to
hold resources temporarily while running the scripts that build the
Trends.Earth documenation. You may have images listed under that folder if
you have ever built the documenation on that machine. This folder should
never be used to add new resources - new resources should always go under
docs\\resources\\en or, for translated images, the appropriate
language-specific folder under docs\\resources.
Contributing as a translator
The translations for both the QGIS plugin and also for this site are managed by transifex. If you’d like to contribute to translating the plugin and documentation (and we’d love to have your help!) you can request to join our team through transifex, or by emailing us at trends.earth@conservation.org.