开发
|trends.earth|是免费的开源软件,根据`GNU通用公共许可证,2.0版或更高版本<https://www.gnu.org/licenses/old-licenses/gpl-2.0.en.html>`_许可。
|trends.earth|工具有许多组成部分。首先是一个QGIS插件,支持指标的计算、原始数据的访问、报告和打印地图的制作。该插件的代码,以及如果您想修改代码的进一步安装说明,都在`trends.earth <https://github.com/ConservationInternational/trends.earth>`_ GitHub软件仓库中。
QGIS插件由一些不同的Python脚本支持,这些脚本允许在谷歌地球引擎(GEE)上计算各种指标。这些脚本位于该GitHub资源库的 "gee "子文件夹中。GEE脚本由 "landdegradation "Python模块支持,该模块包括处理插件的输入和输出的代码,以及其他支持NDVI积分计算、统计意义和其他共享代码的通用功能。这个模块的代码可以在GitHub上的`landdegradation <https://github.com/ConservationInternational/landdegradation>`_软件仓库中找到。
关于如何通过编写插件代码、修改处理代码或为翻译网站和插件做出贡献,更多细节见下文。
修改QGIS插件的代码
下载trends.earth代码
Trends.Earth插件和支持它的谷歌地球引擎脚本的代码都位于GitHub上的`trends.earth <https://github.com/ConservationInternational/trends.earth>`_软件仓库中。克隆这个软件仓库到您机器上方便的位置,以确保您拥有最新版本的代码。
trends.earth软件仓库中有许多不同的分支正在积极开发中。该插件正式支持QGIS3,大部分的开发工作是在 "开发(development) "分支上进行的。"qgis2 "分支是该插件的旧版本,支持QGIS2的2.18以上版本。
安装依赖项
Python
该插件是用Python编码的。除了用于通过QGIS运行该插件外,Python还用于支持管理该插件(改变版本、安装开发版本等)。虽然Python包含在QGIS中,但您也需要一个本地版本的Python,可以用管理插件所需的软件来设置。管理多个Python版本的最简单方法是通过`Anaconda distribution<https://www.anaconda.com>`_。对于开发该插件的工作,需要Python 3。要通过Anaconda下载Python 3.7(推荐),请看这个页面。
Python 依赖项
为了使用trends.earth代码,您需要在机器上安装Invoke,以及其他一些用于管理文档、翻译等的包。这些软件包都列在Trends.Earth的 "dev "需求文件中,因此,为了安装这些文件,可以通过在命令提示符中导航到trends.earth代码文件夹的根部并输入:
pip install -r requirements-dev.txt
备注
如果您使用的是 Anaconda,在运行上述命令 (以及页面上列出的其他任何调用命令) 之前,首先要激活一个 Python 3.7 虚拟环境。一种方法是通过启动 "Anaconda提示符",`按照这个Anaconda页面上的说明<https://docs.anaconda.com/anaconda/user-guide/getting-started/#write-a-python-program-using-anaconda-prompt-or-terminal>`_来实现。
PyQt
PyQt5是QGIS3使用的图形工具箱。要为Trends.Earth编译QGIS3的用户界面,你需要安装PyQt5。这个软件包可以从pip上安装,方法是:
pip install PyQt5
备注
PyQt4是QGIS2使用的图形工具箱。这个软件包在Windows上的最佳来源是由加州大学欧文分校的Christoph Gohlke维护的软件包集。要下载PyQt4,请选择 "本页中的相应软件包<https://www.lfd.uci.edu/~gohlke/pythonlibs/#pyqt4>"。为您所使用的Python版本选择合适的文件。例如,如果您使用的是Python 2.7,选择文件名中带有 "cp27 "的版本。如果使用的是Python 3.7,选择文件名中带有 "cp37 "的版本。选择 "amd64 "表示64位Python,选择 "win32 "表示32位Python。
从上面的链接下载后,使用``pip``来安装它。例如,对于Python 3.7的64位Wheel,你可以运行:
pip install PyQt4-4.11.4-cp37-cp37m-win_amd64.whl
修改插件的版本
Trends.Earth的惯例是,以奇数结尾的版本号(例如0.65)是开发版本,而以偶数结尾的版本(例如(0.66))是发布版本。插件的开发版本不会通过QGIS软件仓库发布,因此插件的普通用户不会看到它们。奇数的开发版本由Trends.Earth开发团队在公开发布前测试新功能时使用。
如果您想对代码进行修改,并且已经下载了该插件的公开版本(以偶数结尾的版本),第一步是将该插件的版本更新到下一个连续的奇数。因此,例如,如果您下载了0.66版本的插件,需要在开始修改之前将版本更新为0.67。在代码中,有几个地方提到了版本(以及在每个GEE脚本中),所以有一个调用任务来协助改变版本。要把版本改为0.67,您可以运行:
invoke set-version -v 0.67
运行上述命令将更新代码中每处被引用的版本号。为了避免混淆,千万不要把版本号改为已经发布的版本--始终把版本标签的值增加到下一个奇数。
测试插件的修改
在对插件代码进行修改后,您需要对其进行测试,以确保插件的行为符合预期,并确保没有出现错误。该插件在发布到QGIS软件仓库(其他用户可以访问的地方)之前应该经过广泛的测试,以确保对代码的任何修改不会破坏该插件。
为了测试您在QGIS中对插件所做的任何改动,您需要将其安装到本地。有一些调用任务可以帮助完成这一过程。在安装该插件之前,首先要确保已经设置了该插件的所有依赖项,以便在QGIS中运行。要做到这一点,请运行:
invoke plugin-setup
上述任务只需要在下载trends.earth代码后立即运行,或者在对插件的依赖性有任何改变时运行。默认情况下,``插件-设置(plugin-setup)``会重新使用你机器上的任何缓存文件。要从头开始,请在上述命令中加入`-c`(clean)标志。
运行``plugin-setup``后,您就可以将该插件安装到您机器上的QGIS插件文件夹中。要做到这一点,请运行:
invoke plugin-install
运行上述命令后,您需要:1)重新启动QGIS,或2)使用 "插件重新加载器<https://plugins.qgis.org/plugins/plugin_reloader/>"_重新加载Trends.Earth插件,以查看您所做的修改的效果。
默认情况下``插件-安装(plugin-install)``会覆盖你机器上的任何现有插件文件,但会保留插件可能下载的任何数据(管理边界等)。要从头开始,请在上述命令中添加`-c``(clean)标志。您可能需要关闭QGIS,以便使用`-c``标志成功执行插件的清洁安装。
备注
在默认情况下,plugin-install假定您要安装的插件是在QGIS3中使用的。若要安装在QGIS3中使用的插件,请在``plugin-install``命令中添加``-v 2``的标志。请记住,该插件在QGIS3上不一定能完全发挥作用 - 该插件最初是为QGIS2设计的,目前仍在QGIS3上进行测试。
同步和部署对二进制文件的修改
为了加快Trends.Earth的计算速度,一些工具允许使用已经用`numba <https://numba.pydata.org>`_编译过的预编译二进制文件。Numba是一个开源的编译器,可以编译Python和NumPy代码,使其比作为普通Python运行时更快。为了避免Trends.Earth的用户需要下载Numba和它的所有依赖项,Trends.Earth团队提供了预编译的二进制文件供下载,如果用户选择安装的话。
要为你的机器上运行的操作系统、位数(32/64位)和Python版本生成预编译的二进制文件,使用:
invoke binaries-compile
备注
你需要一个C++编译器才能使上述命令生效。在Windows上,请参阅`这个github页面<https://wiki.python.org/moin/WindowsCompilers#Which_Microsoft_Visual_C.2B-.2B-_compiler_to_use_with_a_specific_Python_version_.3F>`_,了解如何安装你的Python版本所需的Microsoft Visual C++编译器的细节。在MacOS上,你很可能需要安装Xcode。在Linux上,安装适当版本的GCC编译器。
为了使二进制文件公开可用,它们通过亚马逊网络服务S3储存桶分发。要把用上述命令生成的二进制文件上传到该储存桶,请运行:
invoke binaries-sync
备注
如果你没有允许写入S3上的`trends.earth'`储存桶的密钥,上述命令将失败。
上述命令将把每个单独的二进制文件同步到S3。然而,工具箱的用户下载的二进制文件是一个与他们正在使用的插件版本相联系的单一压缩文件。要生成该压缩文件,以便Trends.Earth用户可以访问它,请运行:
invoke binaries-deploy
备注
如果你没有允许写入S3上的`trends.earth'`储存桶的密钥,上述命令将失败。
建立一个插件压缩文件
有几个调用任务可以帮助建立一个压缩文件,以便将插件部署到QGIS软件仓库中,或与他人分享插件的开发版本。要将该插件及其所有依赖项打包成一个压缩文件,以便按照 "Trends.Earth readme <https://github.com/ConservationInternational/trends.earth#installing-latest-packaged-development-version>"中描述的过程进行安装,请运行:
invoke zipfile-build
这个命令将在trends.earth代码文件夹的根部创建一个名为``创建(build)``的文件夹,并在该文件夹中创建一个名为``LDMP.zip``的文件。这个文件可以与其他人共享,他们可以用它来`手动安装Trends.Earth <https://github.com/ConservationInternational/trends.earth#installing-latest-packaged-development-version>`_。如果需要在插件的公开发布版本之前与人分享最新的功能,这可能很有用。
部署开发版本的压缩文件
Trends.Earth的GitHub页面给出了一个压缩文件的链接,允许可能不是开发者的用户访问Trends.Earth的开发版本。要创建一个压缩文件并使其在该页面上可用(压缩文件存储在S3上),请运行:
invoke zipfile-deploy
该命令将打包该插件并将其复制到`https://s3.amazonaws.com/trends.earth/sharing/LDMP.zip <https://s3.amazonaws.com/trends.earth/sharing/LDMP.zip>`_。
备注
如果你没有允许写入S3上的`trends.earth'`储存桶的密钥,上述命令将失败。
修改地球引擎的处理代码
Trends.Earth使用的Google Earth Engine(GEE)处理脚本都存放在trends.earth主文件夹下的 "gee "文件夹中。为了让trends.earth QGIS插件的用户能够访问这些脚本,必须将它们部署到保护国际组织维护的api.trends.earth服务中,以便让插件的用户能够使用地球引擎,而不需要知道如何编程,也不需要在GEE上拥有个人用户账户。下面介绍如何测试和部署GEE脚本,以便与Trends.Earth一起使用。
设置依赖项
trends.earth-CLI
"trends.earth-CLI "Python 包是与 api.trends.earth 服务器一起工作所必需的。这个包位于GitHub上的`trends.earth-CLI <https://github.com/Vizzuality/trends.earth-CLI>`_软件仓库。
第一步是将这个版本库克隆到您的机器上。我们建议您将版本库克隆到存放trends.earth代码的同一文件夹中。例如,如果机器上有一个 "代码 "文件夹,把`trends.earth <https://github.com/ConservationInternational/trends.earth>`_软件仓库(QGIS插件和相关GEE脚本的代码)和`trends.earth-CLI <https://github.com/Vizzuality/trends.earth-CLI>`_软件仓库克隆到同一文件夹。
当您按照上述建议设置系统时,trends.earth-CLI 将与用于管理 Trends.earth 的调用任务一起运行,无需任何修改。但是,如果您将 trends.earth-CLI 下载到不同的文件夹中,那么您需要将一个名为 "invoke.yaml" 的文件添加到 trends.earth 存储库的根目录中,并在此文件中告诉 Trends.Earth 在哪里 找到 trends.earth-CLI 代码。此 YAML 文件应如下所示(如果您将 Windows 上的代码下载到名为 "C:/Users/azvol/Code/trends.earth-CLI/tecli" 的文件夹中):
gee:
    tecli: "C:/Users/azvol/Code/trends.earth-CLI/tecli"
同样,如果您按照上述建议设置系统,则**不需要**添加此 .yaml 文件。
docker
Trends.earth-CLI 包需要 docker 才能运行。按照这些说明在 Windows 上安装 docker,和`这些说明在 Mac OS 上安装 docker <https://docs.docker.com/docker-for-mac/install/>`_。如果您正在运行 Linux,请遵循此页面上的说明<https://docs.docker.com/install>`_,适合您使用的 Linux 发行版。
本地测试 Earth Engine 脚本
安装 Trends.earth-CLI 包后,您需要设置一个 .tecli.yml 文件,其中包含 GEE 服务账户的访问令牌,以便在 GEE 上测试脚本。要为 tecli 设置 GEE 服务账户,首先以 JSON 格式(从谷歌云控制台)获取您的服务账户的密钥,然后将其编码为 base64。
invoke tecli-config set EE_SERVICE_ACCOUNT_JSON key
其中,"key" 是 base64 编码的 JSON 格式服务账户密钥。
在将脚本指定要在 GEE 上运行的代码从 JavaScript 转换为 Python 时,或者在修改此代码时,在本地测试脚本而不将其部署到 api.trends.earth 服务器会很有用。为此,请使用``run``调用任务。例如,要测试“land_cover”脚本,请转到 Trends.Earth 代码的根目录,然后在命令提示符下运行:
invoke tecli-run land_cover
这将使用 Trends.earth-CLI 包来构建和运行一个 docker 容器,此容器将尝试运行 "land_cover" 脚本。如果脚本中有任何语法错误,这些将在容器运行时显示。 在向 api.trends.earth 提交新脚本之前,请始终确保 invoke tecli-run 能够运行脚本而不会出现任何错误。
当使用 invoke tecli-run 时,您可能会收到一个错误提示:
Invalid JWT: Token must be a short-lived token (60 minutes) and in a
reasonable timeframe. Check your iat and exp values and use a clock with
skew to account for clock differences between systems.
如果 docker 容器上的时钟与系统时钟不同步,则可能会导致此错误。重新启动 docker 应该可以解决此错误。
将 GEE 脚本部署到 api.trends.earth
当您完成 GEE 脚本的测试,并希望 QGIS 插件(以及 Trends.Earth 的其他用户)可以访问它时,您可以将它部署到 api.trends.earth 服务器。此过程的第一步是登录 api.trends.earth 服务器。要登录,请运行:
invoke tecli-login
您将被要求输入用户名和密码。 这些与您用于从 QGIS 插件登录 Trends.Earth 服务器的用户名和密码相同。您如果不是管理员,将可以登录,但以下命令将失败。要将脚本(例如 "land_cover" 脚本)上传到服务器,请运行:
invoke tecli-publish -s land_cover
如果服务器上已经存在此脚本,系统将询问您是否要覆盖现有脚本。上传带有偶数版本的脚本时要非常小心,因为这些是公开可用的脚本,您犯的任何错误都会影响使用此插件的人。每当您进行测试时,请务必使用开发版本号(奇数版本号)。
将脚本发布到服务器后,您可以使用 tecli-info 任务检查脚本的状态(以了解它是否部署成功——尽管注意构建脚本可能需要几分钟)。要检查已部署脚本的状态,请运行:
invoke tecli-publish -s land_cover
如果您正在制作插件的新版本,并且想要一次上传所有 GEE 脚本(每当插件版本号更改时,这是必需的),请运行:
invoke tecli-publish
同样地——除非您打算覆盖插件使用的所有公开可用的脚本,否则切勿在公开发布的插件版本上运行上述内容。
编辑矢量图层模板
Trends.Earth 让用户可以数字化新的矢量特征,来描绘特别感兴趣的区域。
目前仅支持“假阳性/阴性”层,但如有必要,可以添加更多。任何矢量图层都是从模板 GeoPackage 文件创建的,可以在插件安装目录的 data/error_recode 文件夹中找到。每种矢量类型有 6 个模板文件,每种联合国官方语言有一个。ISO 语言代码作为后缀添加到文件名。这对于在属性形式中提供本地化标签是必要的。当请求创建矢量图层时,QGIS 将查找将 QGIS 语言环境纳入账户的模板文件,作为使用模板文件的英文版本的备用选项。
要更改图层的架构,需要更改插件安装目录的“data/error_recode”文件夹中的相应模板文件。模板文件还包含一个内置的默认样式和属性表单配置,在加载到 QGIS 时将自动应用于图层。
为了在属性表单中显示图表,使用了内置的 QML 小部件。图表数据存储在矢量图层属性表中。借助表达式从相应字段中提取的值。
生成图表的代码如下所示:
import QtQuick 2.0
import QtCharts 2.0

ChartView {
    width: 380
    height:200
    margins {top: 0; bottom: 0; left: 0; right: 0}
    backgroundColor: "#eeeeec"
    legend.alignment: Qt.AlignBottom
    antialiasing: true
    ValueAxis {
        id: valueAxisY
        min: 0
        max: 100
    }

    BarSeries {
        id: mySeries
        axisY: valueAxisY
        axisX: BarCategoryAxis { categories: ["Productivity", "Land cover", "Soil organic carbon"] }
        BarSet { label: "Degraded"; color: "#9b2779"; values: [expression.evaluate("\"prod_deg\""), expression.evaluate("\"land_deg\""), expression.evaluate("\"soil_deg\"")] }
        BarSet { label: "Improved"; color: "#006500"; values: [expression.evaluate("\"prod_imp\""), expression.evaluate("\"land_imp\""), expression.evaluate("\"soil_imp\"")] }
        BarSet { label: "Stable"; color: "#ffffe0"; values: [expression.evaluate("\"prod_stab\""), expression.evaluate("\"land_stab\""), expression.evaluate("\"soil_stab\"")] }
    }
}
要提取字段值函数 expression.evaluate("\"prod_deg\"") 使用,它接受的唯一参数是字段的名称。对于假阳性/阴性层,图表包含三个指标:生产力、土地覆盖和土壤有机碳。对于每个指标插件,保持三个值稳定、退化和改进的多边形区域百分比。例如,在生产力指标字段的情况下,将是:
prod_deg——生产力下降
prod_stab——生产力稳定
prod_imp——生产力提升
相同的命名方法应用于土地覆盖(land_* 字段)和土壤有机碳(soil_* 字段)。
面积百分比的计算是通过自定义表达式函数完成的,其代码可以在插件根目录下的``charts.py``文件中找到。功能优化以处理大型多边形并使用以下工作流程。对于给定的几何图形,找到一个 bbox 并用它来提取栅格子集。执行内存几何光栅化,并将其作为掩码应用于光栅。然后计算具有特定值的像素数并计算百分比。由于像素计数建立在 numpy 数组函数上,因此即使对于大型多边形也非常快。
在第一次尝试编辑矢量图层时,用户将看到一个对话框,他们应该在其中选择要用于指标的数据集。然后插件将为所有指标字段设置默认表达式值,因此,此值将在每次几何更改时更新。
数据集元数据处理
数据集元数据以 QGIS QMD 格式存储。这些 QMD 文件可以为每个栅格单独创建,也可以为整个数据集创建。元数据编辑器对话框从 Trends.Earth 停靠栏的 编辑元数据 菜单打开。
将数据集导出到 ZIP 时,使用 XSLT 转换执行到 ISO XML 的转换。相应的转换位于插件安装文件夹的 data\xsl 子目录中。
更新报告框架
报告框架概述
报告框架设计为可扩展的,同时还通过非阻塞操作向用户提供交互性。此框架大量利用 QgsProject 和 QgsPrintLayout 类,它们的线程不安全,因此使用 qgis_process 来完成生成报告(和图表)的繁重工作。您可以在 `此处<https://docs.qgis.org/3.22/en/docs/user_manual/processing/standalone.html>`_ 找到关于 qgis_process 的更多信息。
在为作业中的默认图层生成报告(和图表)时,工具箱会执行两个主要步骤:
它创建一个
ReportTaskContext对象,此对象构成一个ReportConfiguration对象(请参阅 配置报告参数)和一个在 数据集 面板中表示的Job对象。这个ReportTaskContext对象被序列化为 JSON 文件,然后作为参数之一传递给ReportProcessHandlerTask对象(继承自 QgsTask)。ReportProcessHandlerTask对象启动一个单独的qgis_process实例,并将 JSON 文件的路径作为trendsearth:reporttask处理算法的输入传递。这是一个瘦包装器,将文件反序列化为ReportTaskContext对象,并将其传递给负责生成报告和作业的 QGIS 项目的ReportTaskProcessor对象。对于需要图表的算法,ReportTaskProcessor对象将作业对象传递给AlgorithmChartsManager对象,此对象检查是否为作业算法定义了图表配置。如果已定义,它会将相应的图表生成为 PNG 文件。(关于图表配置的更多信息,请参阅 添加图表配置)
下图提供了此过程的高级说明:
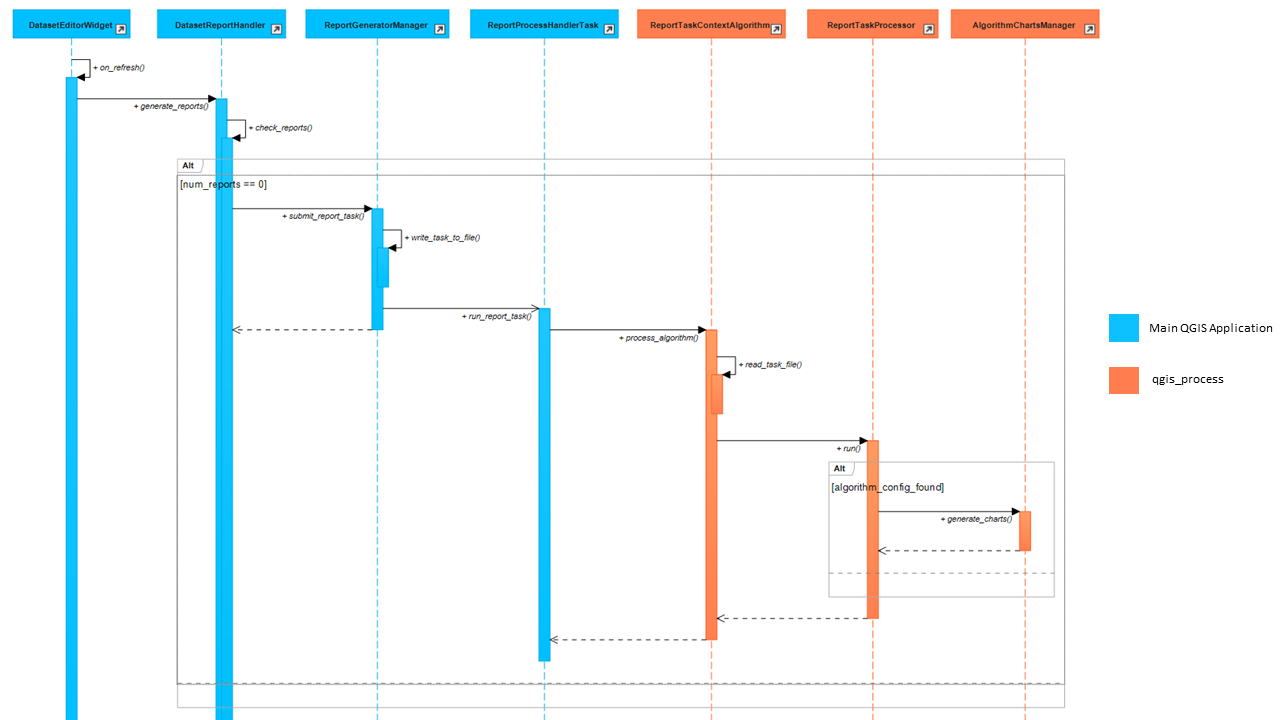
* 点击图片以查看大图。
备注
出于说明目的,上图中的一些函数名称已简化。上述类可以在 LDMP.reports 和 LDMP.processing_provider.report 模块中找到。
添加报告布局变量
报告变量在报告执行过程中提供与作业、层(或波段)或 报告 相关的上下文信息。目前,此工具箱支持 布局表达式变量 部分中列出的变量。
每个变量在 LDMP.reports.expressions 模块中定义为一个 namedtuple,随后由 ReportTaskProcessor 对象进行更新和评估。
请遵循以下关于如何添加新作业或当前图层变量的指南。
作业变量
它可以将关于当前作业——正在执行——的信息添加到报告布局中。每个作业变量的信息都封装在一个 JobAttrVarInfo 对象中,此对象由四个属性组成:
属性名称 |
描述 |
数据类型 |
默认值 |
|---|---|---|---|
job_attr |
|
字符串 |
不适用 |
var_name |
报告布局变量的名称。它应该以 te_job_ 为前缀。 |
字符串 |
不适用 |
default_value |
var_name 使用的默认值,主要应用于设计布局时。 |
对象 |
对象 |
fmt_func |
用于将作业的属性值转换为与 QGIS 表达式兼容的格式的函数对象。例如, |
函数对象 |
全无 |
下方的代码片段显示了如何添加对应于 job.results.name 的变量 te_job_result_name。
# LDMP/reports/expressions.py
def _job_attr_var_mapping() -> typing.List[JobAttrVarInfo]:
    return [
        ...
        JobAttrVarInfo('results.name', 'te_job_result_name', '', str),
        ...
    ]
图层变量
它提供关于当前正在执行的栅格图层的信息。此变量信息被封装在一个 LayerVarInfo 对象中,此对象由三个属性组成:
属性名称 |
描述 |
数据类型 |
默认值 |
|---|---|---|---|
var_name |
报告布局变量的名称。它应该以 te_current_layer_ 作为前缀。 |
字符串 |
不适用 |
default_value |
var_name 使用的默认值,主要应用于设计布局时。 |
对象 |
对象 |
fmt_func |
一个函数对象,用于从 QgsRasterLayer 对象中提取值,和/或将值转换为与 QGIS 表达式兼容的格式。您也可以在此处使用 lambda 函数。 例如, |
函数对象 |
全无 |
下方的代码片段显示了如何添加与栅格图层高度相对应的变量 te_current_layer_height。
# LDMP/reports/expressions.py
def _current_job_layer_var_mapping() -> typing.List[LayerVarInfo]:
    return [
        ...
        LayerVarInfo(
            'te_current_layer_height',
            '',
            lambda layer: layer.height()
        )
        ...
    ]
备注
这些变量仅在布局范围内可用。
添加图表配置
可以使用对应于特定算法的图表配置对象,对图表进行分组。定义新的图表配置是一个三步过程:
在 LDMP.reports.charts 模块中,创建一个继承自
BaseChart的新图表类。使用 QGIS 附带的PlotlyPython 库实现export函数以指定图表类型、属性等。最后,在export函数中,调用save_image函数以使用 Qt 的QImageWriter类支持的任何格式,将 Plotly 的Figure对象写入图像文件。您还可以将路径指定为相对于根输出目录的路径,此路径也可用作基类中的属性。请参阅下方的代码片段:# LDMP/reports/charts.py Class MyCustomChart(BaseChart): def export(self) -> typing.Tuple[bool, list]: status = True messages = [] # Create chart Figure using Plotly and set properties fig = go.Figure(...) # Add warning or error messages messages.append('Colour list not supported.') # Set image path in dataset's reports folder img_path = f'{self.root_output_dir}/chart-NDVI.png' # Save image and append its path self.save_image(fig, img_path) self._paths.append(img_path) return status, messages
对于更完整的示例,可以参考
UniqueValuesPieChart类。创建一个继承自
BaseAlgorithmChartsConfiguration的图表配置类,并实现_add_charts函数。图表配置类基本定义了哪些图表将用于给定算法。layer_band_infos属性是一个LayerBandInfo对象列表,其中包含生成图表所需的图层和 band_info 数据。您可以参考LandCoverChartsConfiguration类以获得更完整的示例。最后,将算法(名称)映射到
AlgorithmChartsManager类中对应的图表配置类,如下所示:# LDMP/reports/charts.py Class AlgorithmChartsManager: def _set_default_chart_config_types(self): ... self.add_alg_chart_config('land-cover', LandCoverChartsConfiguration) self.add_alg_chart_config('productivity', MyCustomLandProductivityChartsConfiguration) ...
在
ReportTaskProcessor对象中实例化的AlgorithmChartsManager类,将在生成报告时为相应作业的算法创建一个新的图表配置对象。
为文档做贡献
概况
Trends.Earth 的文档是使用 Sphinx 生成的,并以 reStructuredText 格式编写。如果您不熟悉这些工具中的任何一个,请参阅它们的文档以获取关于如何使用它们的更多信息。
Trends.Earth 的文档存储在 Trends.earth 主目录下的 "docs" 文件夹中。在此文件夹中,有许多需要注意的重要文件和文件夹:
构建:包含 Trends.earth 的构建文档(PDF 和 HTML 格式)。注意,它只会在运行
docs-build调用任务后出现在您的机器上。i18n:包含将文档翻译成其他语言的版本。这里的文件通常是使用调用任务自动处理的,所以您不应该修改此文件夹中的任何东西。
资源:包含文档中提到的任何资源(主要是图像或 PDF)。目前只有一个文件夹("EN",表示英语),因为文档中的所有图像都来自插件的英语版本——如果合适,可以在“资源”下添加带有两个字母语言代码的附加文件夹,以包含特定语言的图像。
源:包含定义文档的 reStructuredText 源文件(这些是文档的实际英文文本,是您最有可能需要修改的文件)。
安装依赖项
Python 依赖项
为使用文档,您需要在机器上安装 invoke、Sphinx、sphinx-intl 和 sphinx-rtd-theme(Trends.Earth 网站的主题)。这些包都列在 Trends.Earth 的“开发”需求文件中,因此,可以在命令提示符中导航到 Trends.earth 代码文件夹的根目录,并键入以下内容以安装它们:
pip install -r requirements-dev.txt
LaTeX
LaTeX 用于生成 Trends.Earth 文档的 PDF 输出。
要在 Windows 上安装,请按照此处列出的过程 <https://www.tug.org/protext>`_,从此处提供的 zip 文件 <http://ftp.math.purdue.edu/mirrors/ctan.org/systems/windows/protext/>`_ 安装 LaTeX 的 proTeXt 发行版。LaTeX 安装程序非常大(数个 GB),因此下载和安装可能需要一些时间。
在 MacOS 上,MacTeX 是个很好的选择,可以按照此处的说明进行安装<http://www.tug.org/mactex/>`_。
在 Linux 上,安装 LaTeX 应该更容易——使用您发行版的包管理器,来查找和安装默认包含的任何 LaTeX 发行版。
Qt Linguist
为了从代码和 GUI 中提取字符串进行翻译,还需要 Qt Linguist。"lrelease" 命令必须可用并且在您的路径上。请尝试:
lrelease
在终端窗口中。您如果找不到文件,则需要安装 Qt Linguist。此页面 是 Qt Linguist 安装程序的一个来源。安装 Qt Linguist 后,确保将包含 lrelease 的文件夹添加到路径中,以便 Trends.Earth 调用脚本可以找到。
更新和构建文档
安装 sphinx 要求后,您就可以开始修改文档了。要修改的文件位于 "docs\source" 文件夹下。对这些文件进行更改后,您将需要构建文档以查看结果。Trends.Earth 文档有两个版本:HTML 版本(用于网站)和 PDF 版本(用于离线下载)。要构建 Trends.Earth 的文档,请使用 "docs-build" 调用任务。默认情况下,此任务将为 Trends.Earth 构建所有支持语言的 HTML 和 PDF 格式的完整文档。这可能需要一些时间来运行(最多几个小时)。如果您只是测试对文档进行一些细微更改的结果,通常最好使用``-f`` 选项(用于“快速”)。此选项将仅构建英文 HTML 文档,这应该只需要几秒钟。要使用快速选项构建,请运行:
invoke docs-build -f
上方的命令需要几秒钟才能运行,您如果在 "docs\build\html\en" 下查看,会看到文档的 HTML 版本。在浏览器中加载 "index.html" 文件以查看其外观。
要以 PDF 和 HTML 格式构建所有语言的完整文档(请记住,这可能需要几个小时才能完成),请运行:
invoke docs-build
运行上述命令后,您将看到(英文)"docs\build\html\en" 下的 HTML 文档,以及 "docs\build\html\en\pdfs" 下的 PDF 文档。
如果您想测试特定语言(例如,在测试翻译时),您可以指定两个字母的语言代码以仅构建此语言的文档。例如,要仅构建西班牙语文档,请运行:
invoke docs-build -l es
请注意,选项可以组合,因此您可以使用快速选项,通过运行以下命令,仅构建西班牙语文档的 HTML 版本:
invoke docs-build -f -l es
在为网站构建完整文档时,最好先删除文档的所有旧版本,因为它们可能包含更新文档中不再使用的文件。为此,请使用 -c (clean) 选项:
invoke docs-build -c
一般来说,如果您打算共享文档或将其发布到网站上,则 docs-build 必须完成且没有任何错误。但是,在本地测试时,您可能希望忽略仅针对某些语言弹出的文档错误(由于翻译错误等引起的语法错误),并继续构建剩余的文档,无论是否有任何错误。为此,请使用``-i``(忽略错误)选项:
invoke docs-build -i
每当您对文档的文本进行任何更改时,最好将最新的字符串推送到 Transifex,以便进行翻译。要使用任何新的更改来更新 Transifex 上的字符串,请运行:
invoke translate-push
备注
要成功运行上述命令,您需要有 Trends.Earth transifex 账户的密钥。
构建发布文档
在发布新文档之前,请始终从 Transifex 中提取最新的翻译,以便所有翻译都是最新的。为此,请运行:
invoke translate-pull
要构建公开发布的文档版本(网站或 PDF 格式),您必须使用 docs-build 构建整个文档,无需其他参数:
invoke docs-build
此过程必须成功完成且没有错误。如果在此过程中发生任何错误,请查看错误消息,并进行必要的修改以使构建成功完成。一旦构建完成且没有错误,就可以将文件部署在网站上。
备注
上述两个命令也有 -f (强制)选项,强制从 Transifex 拉或推最新的翻译(分别)。仅当您非常确定自己在做什么时才使用这些选项,因为它们可以完全覆盖 Transifex 上的翻译,如果最新的翻译尚未提交到 github,则会导致翻译人员所做的工作丢失。
添加新的文档文本
添加到文档中的任何新 .rst 文件都需要添加到多个配置文件中,以确保它们出现在导航菜单中,它们被正确翻译,并且(对于教程)确保它们以 PDF 格式生成,以便它们可以下载以供离线使用。
docs\source\index.rst:在此处的适当位置添加新的 .rst 文件,以确保从导航菜单链接到它们。
.tx\config:在此处列出新的 .rst 文件(与已包含的其他文件格式相同),以使翻译软件能够识别它们,以便进行翻译
docs\source\conf.py:如果要生成网站页面的 PDF 文件,则必须在
latex_documents列表中列出该页面。通常我们只对希望以个人 PDF 格式提供给研讨会参与者的教程页面执行此操作。网站上的每个页面都将包含在整个网站的 PDF 版本中,无论它是否在latex_documents列表中。
添加新图像或其他资源
文档所需的任何新图像或其他资源(PDF 等)都应添加到 "docs\resources\en" 下。如果需要,可以上传不同版本的图像,以便图像显示正确的翻译。例如,如果您想以适当的语言显示 GUI 界面,这可能很有用。为此,首先将图像的副本上传到 "docs\resourcesen"(其中包含英文文本)。然后,创建带有翻译文本的图像副本,并将此图像放在此语言的相应文件夹下(例如,显示西班牙语翻译的图像将位于 "docs\resources\es" 下)。图像的英文版本将用作未提供图像本地版本的所有语言的默认设置,而本地化版本将在可用时使用。
备注
还有另一个文件夹 docs\\source\\static,用于在运行构建 Trends.Earth 文档的脚本时临时保存资源。如果您曾经在这台机器上构建过文档,那么您可能在此文件夹下列出了图像。永远不要使用此文件夹添加新资源——新资源应始终位于 docs\\resources\\en 下,或者对于翻译的图像,应位于 docs\\resources 下相应的特定语言文件夹。
作为译者做贡献
QGIS 插件和本网站的翻译均由 transifex 管理。您如果想为翻译插件和文档做出贡献(我们很乐意得到您的帮助!),可以通过 transifex <https://www.transifex.com/conservation-international/trendsearth>`_ 请求加入我们的团队,或发送电子邮件至 trends.earth @conservation.org。