Carbon emissions from deforestation
Background
Global forests store carbon, which can be released as carbon dioxide back into the atmosphere from degradation or deforestation, driving climate change. Between 2001-2020, global forests lost 10% area coverage, or 411 million hectares, releasing 165 Gt of carbon dioxide emissions (UMD & WRI, 2022). There is an increasing trend where high losses on tropical primary forests are shifting areas, like the Amazon rainforest, from a carbon sink to a carbon source (Bacchini et al., 2017). Drivers of this loss are attributed to wildfires, shifting agriculture, forestry, urbanization and commodity driven deforestation (Curtis et al., 2019).
Rationale for Monitoring
Monitoring deforestation is the first step to understand the cause of tree cover loss and to plan interventions for preventing it.
Note
Refer to the Forest and Carbon Change Tool for the tutorial to use this methodology and data.
Indicator and data needs
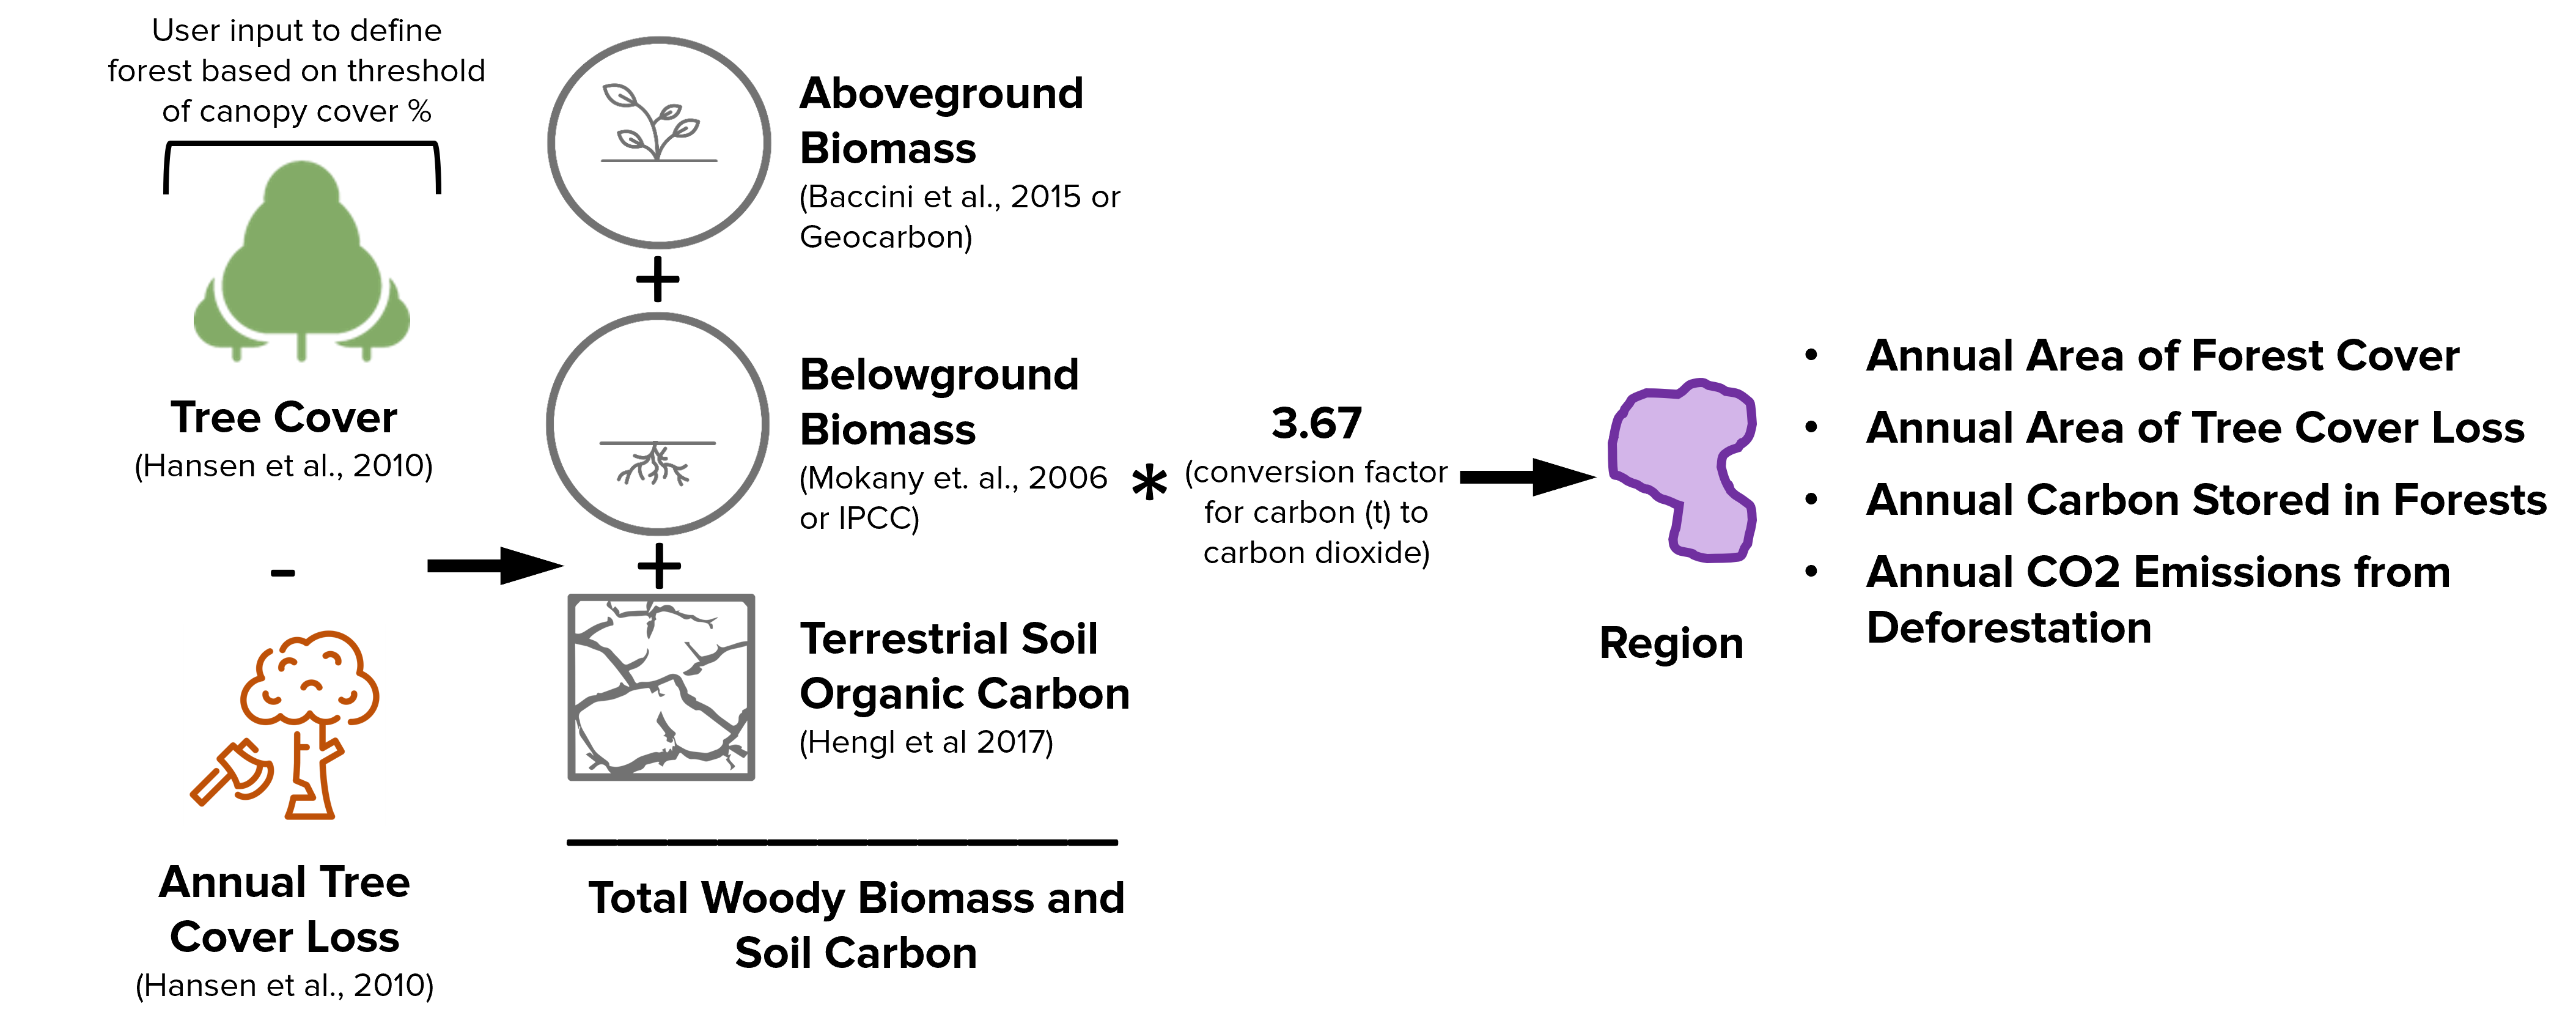
Trends.Earth allows the user to analyze the area of forest cover, carbon stored in forests, forest loss and estimated emissions from deforestation within an area of interest in terrestrial forests anywhere on Earth. The user is first prompted to select the years for monitoring their specified area for the analysis. In order to define the baseline forest area, they will assign a threshold to define forests.
Note
- The definition of canopy cover should be changed to accommodate the specific area of interest.
The dataset maps global tree cover based on percent canopy cover in the year 2000. Many studies cite 25% - 30% threshold to define forest, however this definition can change for arid regions. For more information, please see the publication: Quantification of global gross forest cover “
The region is then selected using the pre-existing national/sub-national boundaries, a coordinate or a custom uploaded dataset.
Note
The Natural Earth Administrative Boundaries provided in Trends.Earth are in the public domain. The boundaries and names used, and the designations used, in Trends.Earth do not imply official endorsement or acceptance by Conservation International Foundation, or by its partner organizations and contributors.
If using Trends.Earth for official purposes, it is recommended that users choose an official boundary provided by the designated office of their country.
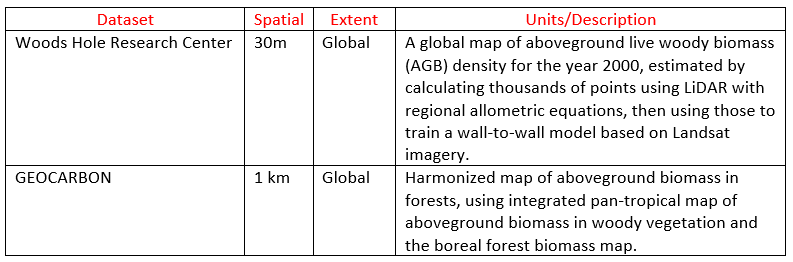
Users can set up *Advanced configuration to use a different biomass dataset, or upload a custom biomass dataset and to select the method for calculating the root to shoot ratio for below ground biomass.
The table below list the biomass datasets available in Trends.Earth:
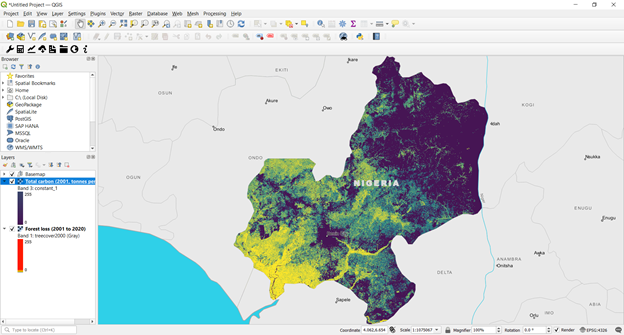
The results provide annual breakdowns of forest cover, forest loss, carbon (tC) stored and carbon emissions (tCO2) for the region, summarizing the baseline and final year land cover, forest area loss, carbon loss and carbon emissions over the entire period. There are two spatial outputs from the analysis. The first is the dataset visualizing the estimated change in biomass:
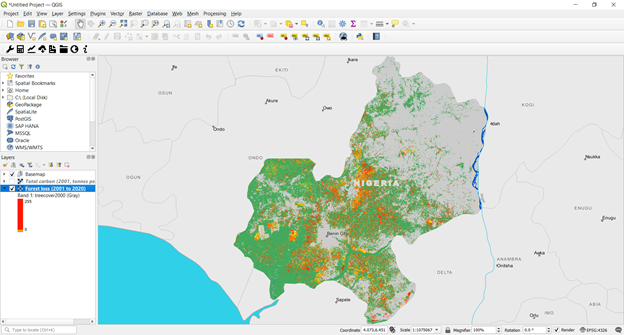
The second is the forest loss layer for the region:
Citations:
Avitabile, V., Herold, M., Heuvelink, G. B. M., Lewis, S. L., Phillips, O. L., Asner, G. P., Armston, J., Ashton, P. S., Banin, L. et al., 2016. An integrated pan-tropical biomass map using multiple reference datasets. Global Change Biology, 22, pp. 1406–1420.
Avitabile, V., Herold, M., Lewis, S.L., Phillips, O.L., Aguilar-Amuchastegui, N., Asner, G. P., Brienen, R.J.W., DeVries, B., Cazzolla Gatti, R. et al., 2014. Comparative analysis and fusion for improved global biomass mapping. Global Vegetation Monitoring and Modeling, 3 – 7 February 2014, Avignon (France).
Baccini, A., W. Walker, L. Carvalho, M. Farina, D. Sulla-Menashe and R. A. Houghton, 2017. “Tropical forests are a net carbon source based on aboveground measurements of gain and loss.” 358 (6360): 230-234. https://www.science.org/doi/10.1126/science.aam5962
Baccini, A., S J. Goetz, W.S. Walker, N. T. Laporte, M. Sun, D. Sulla-Menashe, J. Hackler, P.S.A. Beck, R. Dubayah, M.A. Friedl, S. Samanta and R. A. Houghton. Estimated carbon dioxide emissions from tropical deforestation improved by carbon-density maps. 2012 Nature Climate Change, https://doi.org/10.1038/NCLIMATE1354
Curtis, P.G., C.M. Slay, N.L. Harris, A. Tyukavina, and M.C. Hansen. 2019. “Classifying Drivers of Global Forest Loss.” Science.
Hansen, M. C., S. V. Stehman, and P. V. Potapov. “Quantification of global gross forest cover.” PNAS. 107 (19) 8650-8655. https://www.pnas.org/doi/10.1073/pnas.0912668107
Hansen, M. C., P. V. Potapov, R. Moore, M. Hancher, S. A. Turubanova, A. Tyukavina, D. Thau, S. V. Stehman, S. J. Goetz, T. R. Loveland, A. Kommareddy, A. Egorov, L. Chini, C. O. Justice, and J. R. G. Townshend.“High-Resolution Global Maps of 21st-Century Forest Cover Change.” Science 342 (15 November): 850–53. Data available on-line at: https://earthenginepartners.appspot.com/science-2013-global-forest.
Intergovernmental Panel on Climate Change (IPCC), 2006. IPCC Guidelines for National Greenhouse Gas Inventories � Volume 4. Egglestone, H.S., L. Buendia, K. Miwa, T. Ngara and K. Tanabe (Eds).
Intergovernmental Panel on Climate Change (IPCC), IPCC/IGES, Hayama, Japan. http://www.ipcc-nggip.iges.or.jp/public/2006gl/vol4.html
Mokany, K., R. Raison, A.S. Prokushkin. Critical analysis of root: shoot ratios in terrestrial biomesGlob. Chang. Biol., 12 (1) (2006), pp. 84-96
Santoro, M., Beaudoin, A., Beer, C., Cartus, O., Fransson, J.E.S., Hall, R.J., Pathe, C., Schmullius, C., Schepaschenko, D., Shvidenko, A., Thurner, M. and Wegmüller, U., 2015. Forest growing stock volume of the northern hemisphere: Spatially explicit estimates for 2010 derived from Envisat ASAR. Remote Sensing of Environment, 168, pp. 316-334.
University of Maryland and World Resources Institute. “Global Primary Forest Loss”. Accessed through Global Forest Watch: https://www.globalforestwatch.org/dashboards/global/?category=summary&location=WyJnbG9iYWwiXQ%3D%3D&map=eyJkYXRhc2V0cyI6W3sib3BhY2l0eSI6MC43LCJ2aXNpYmlsaXR5Ijp0cnVlLCJkYXRhc2V0IjoicHJpbWFyeS1mb3Jlc3RzIiwibGF5ZXJzIjpbInByaW1hcnktZm9yZXN0cy0yMDAxIl19LHsiZGF0YXNldCI6InBvbGl0aWNhbC1ib3VuZGFyaWVzIiwibGF5ZXJzIjpbImRpc3B1dGVkLXBvbGl0aWNhbC1ib3VuZGFyaWVzIiwicG9saXRpY2FsLWJvdW5kYXJpZXMiXSwiYm91bmRhcnkiOnRydWUsIm9wYWNpdHkiOjEsInZpc2liaWxpdHkiOnRydWV9LHsiZGF0YXNldCI6InRyZWUtY292ZXItbG9zcyIsImxheWVycyI6WyJ0cmVlLWNvdmVyLWxvc3MiXSwib3BhY2l0eSI6MSwidmlzaWJpbGl0eSI6dHJ1ZSwidGltZWxpbmVQYXJhbXMiOnsic3RhcnREYXRlIjoiMjAwMi0wMS0wMSIsImVuZERhdGUiOiIyMDIwLTEyLTMxIiwidHJpbUVuZERhdGUiOiIyMDIwLTEyLTMxIn0sInBhcmFtcyI6eyJ0aHJlc2hvbGQiOjMwLCJ2aXNpYmlsaXR5Ijp0cnVlfX1dfQ%3D%3D&showMap=true